Maximiliano Firtman [Maximiliano Firtman] - Measurement tools for high performance
Here you can read online Maximiliano Firtman [Maximiliano Firtman] - Measurement tools for high performance full text of the book (entire story) in english for free. Download pdf and epub, get meaning, cover and reviews about this ebook. year: 2017, publisher: O’Reilly Media, Inc., genre: Computer. Description of the work, (preface) as well as reviews are available. Best literature library LitArk.com created for fans of good reading and offers a wide selection of genres:
Romance novel
Science fiction
Adventure
Detective
Science
History
Home and family
Prose
Art
Politics
Computer
Non-fiction
Religion
Business
Children
Humor
Choose a favorite category and find really read worthwhile books. Enjoy immersion in the world of imagination, feel the emotions of the characters or learn something new for yourself, make an fascinating discovery.
![Maximiliano Firtman [Maximiliano Firtman] Measurement tools for high performance](https://litark.com/uploads/posts/book/131650/maximiliano-firtman-maximiliano-firtman.jpg)
- Book:Measurement tools for high performance
- Author:
- Publisher:O’Reilly Media, Inc.
- Genre:
- Year:2017
- Rating:5 / 5
- Favourites:Add to favourites
- Your mark:
Measurement tools for high performance: summary, description and annotation
We offer to read an annotation, description, summary or preface (depends on what the author of the book "Measurement tools for high performance" wrote himself). If you haven't found the necessary information about the book — write in the comments, we will try to find it.
This excerpt reviews the tools that are available to get real data from your mobile browsers.
Maximiliano Firtman [Maximiliano Firtman]: author's other books
Who wrote Measurement tools for high performance? Find out the surname, the name of the author of the book and a list of all author's works by series.


Measurement tools for high performance — read online for free the complete book (whole text) full work
Below is the text of the book, divided by pages. System saving the place of the last page read, allows you to conveniently read the book "Measurement tools for high performance" online for free, without having to search again every time where you left off. Put a bookmark, and you can go to the page where you finished reading at any time.
Font size:
Interval:
Bookmark:
We already know what to measure when we are talking about web performance. The next step is to understand which tools available on the market will help us with measurements on mobile web engines.
One of the most useful tools for us are remote debuggers or remote inspectors. They allow us to connect a desktop browsers tools with a mobile counterpart to do analysis and profiling and get reports from a mobile device. This is particularly useful when measuring things that will be different from the desktops viewport or that are network-dependent (and therefore using a real phone to test the user experience makes a difference).
The RemoteDebug project is an open initiative to bring interoperability between different browser vendors and different developer tools. Its still in the early stages, so in the meantime we will have to use the developer tools available on each platform.
If you have a MacBook or a Mac desktop computer and an iOS device, you can remotely debug websites, home screen web apps, and hybrid applications on the iOS Simulator and on actual devices.
Unfortunately, at the time of this writing, there is no way to open the iOS web debugger from a Windows or Linux desktop computer. We must rely on other nonnative solutions if we need to debug from a non-Mac desktop computer.
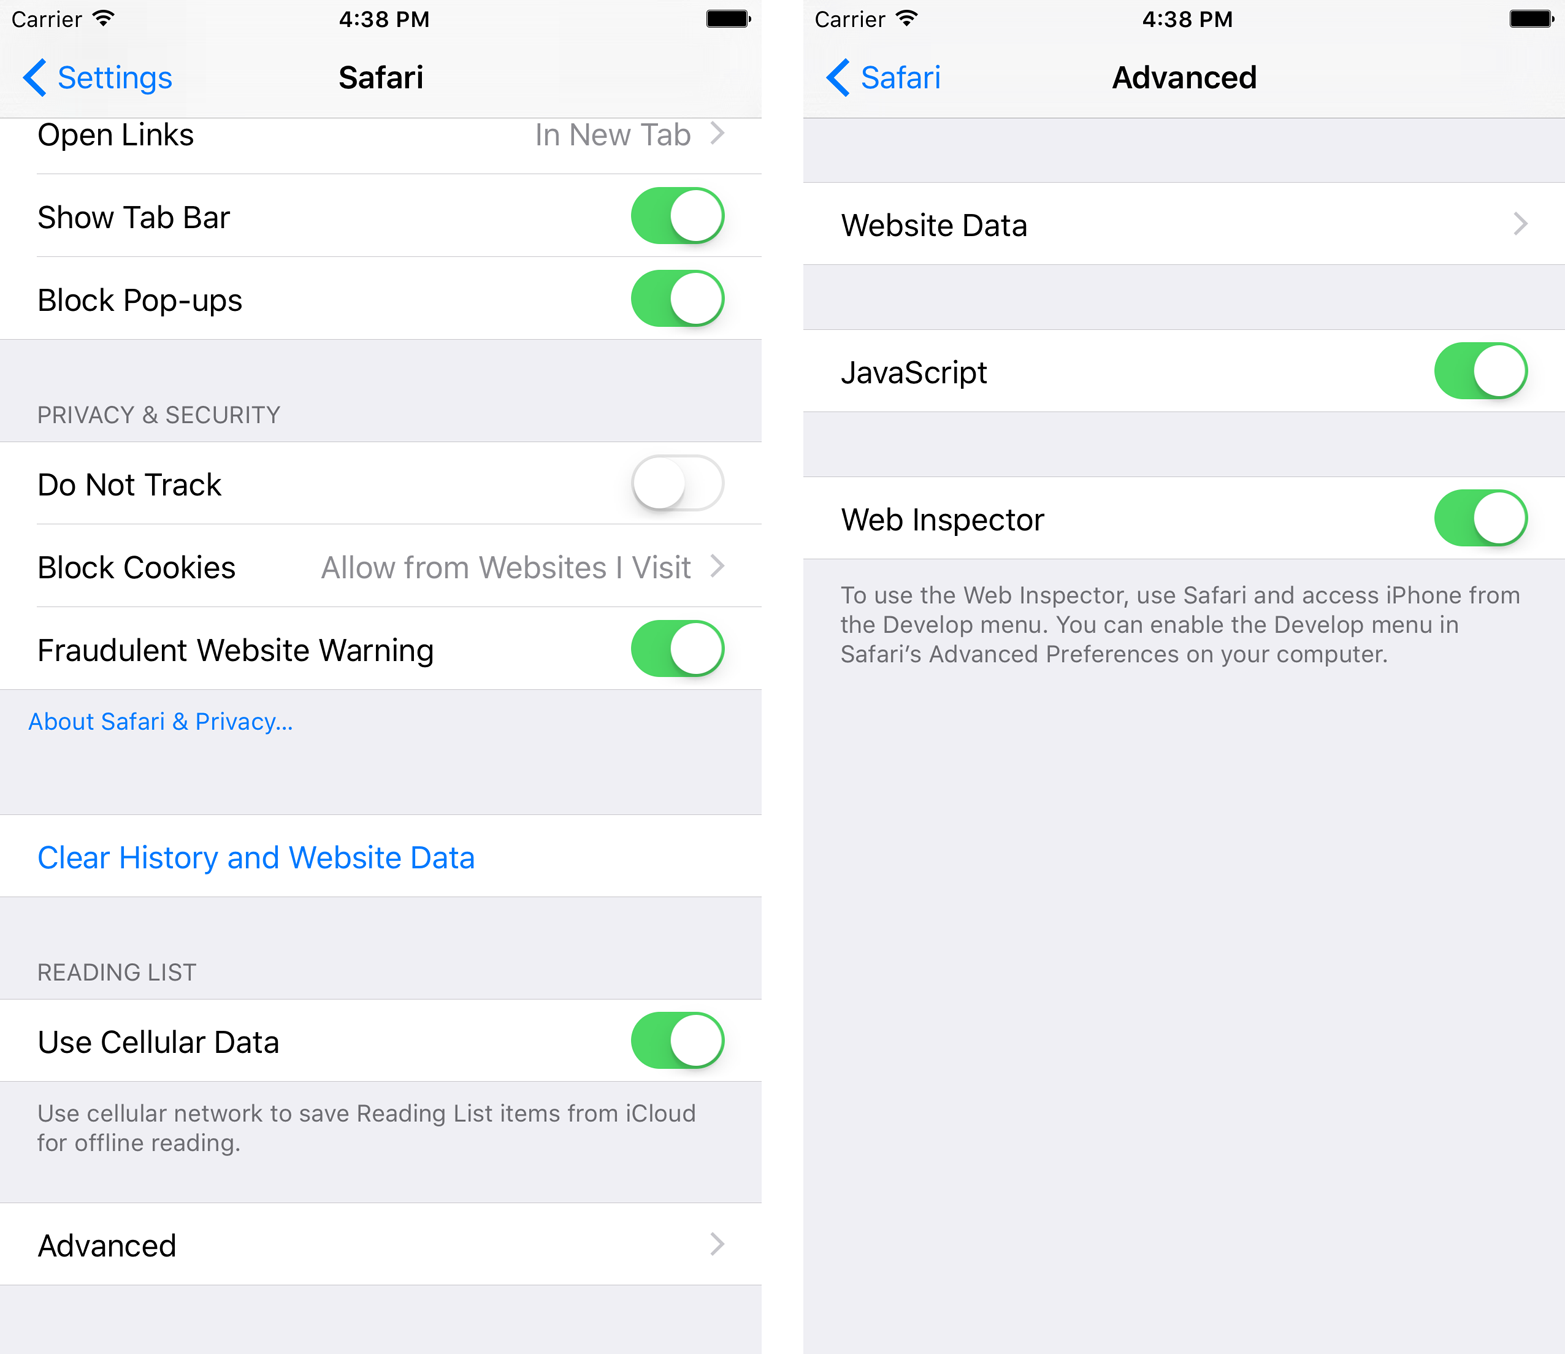
To use the Web Inspector on iOS, you must first enable it from the iOS device (its enabled by default on the Simulator), by going to SettingsSafariAdvanced and turning on the Web Inspector feature, as seen on the right in . Then, you need to connect your device through USB to your desktop computer.
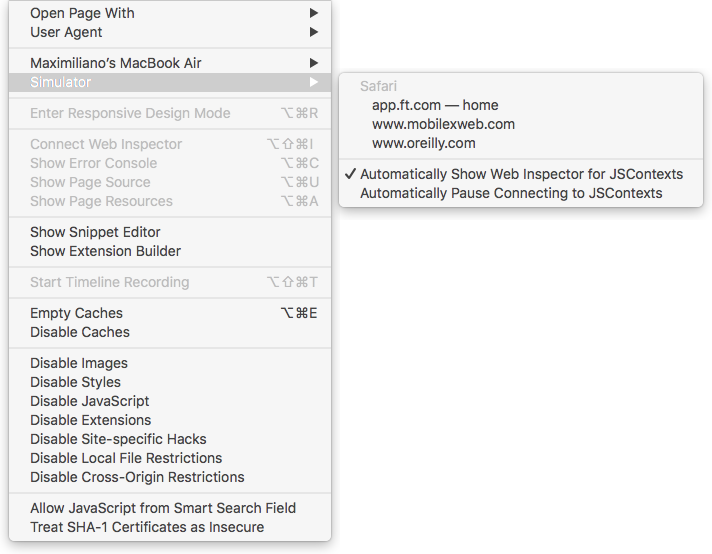
The next step is to enable the developer tools in Safari for Mac, via PreferencesAdvancedShow Develop menu in menu bar. When youve done all this and the session you want to debug is open on the device or in the Simulator, you can access the Develop menu in Safari for Mac; in that menu, youll see the name of your device as a submenu with all the available web sessions to connect to on it, as seen on the right in .
When youre connected, Safari for Mac will open a window withyour debug session user interface (as seen in ).
In the debug session, you will be able to:
Inspect the HTML, CSS, and JavaScript
Browse storage, inspecting cookies, local storage, SQL databases, and more
Record and measure timelines, including network requests, layout and rendering, and JavaScript execution and events
See network requests
See warnings and errors
See web workers (threads)
See and manage JavaScript breakpoints, including watch expressions
We can connect a Remote Web Inspector to a web view running inside a native app only when the app was installed in debug modethat is, its our app and we are installing it from Xcode. Therefore, if you have an app that was installed from the App Store and its using a web view, you wont be able to connect the Inspector to it.
The Safari Web Inspector has different options available depending on the desktops Safari version, such as Safari 8 on macOS 10.10 (Yosemite) and from Safari 9 on macOS 10.11 (El Capitan).
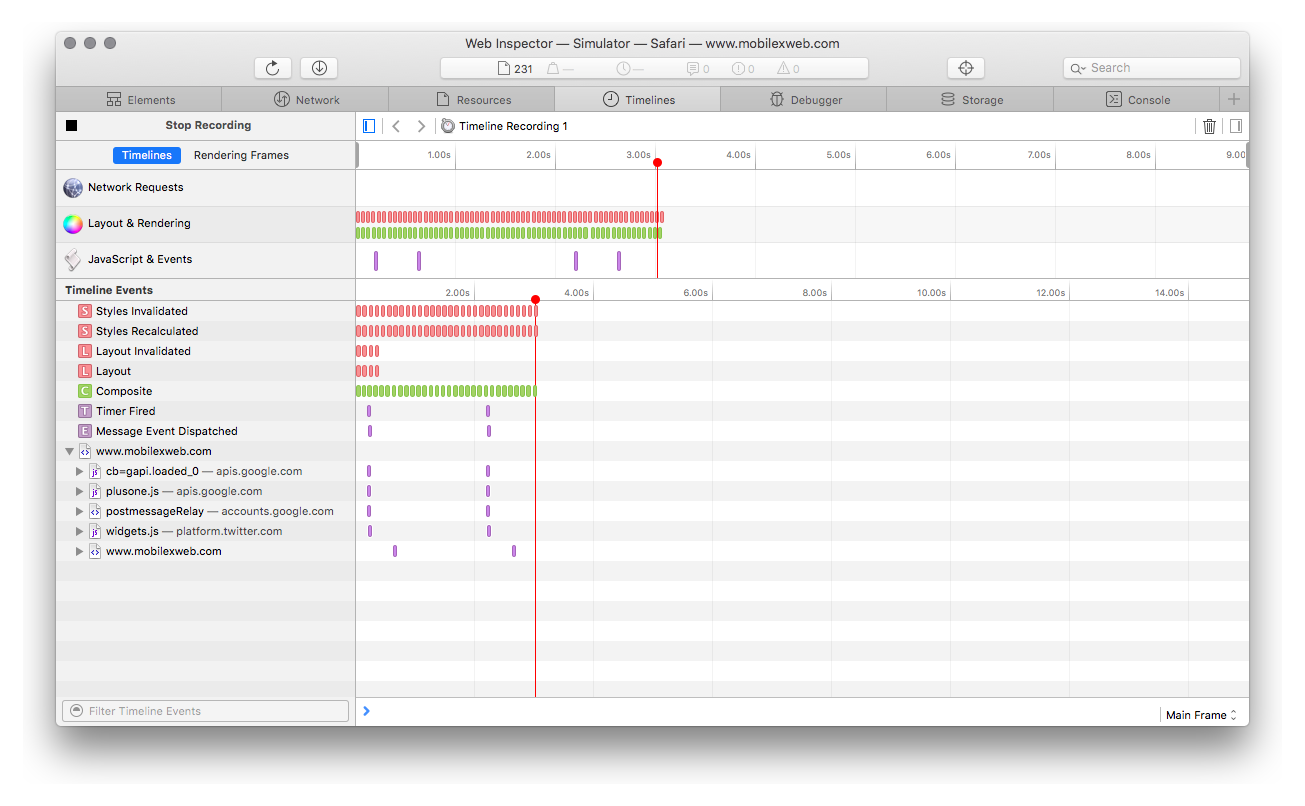
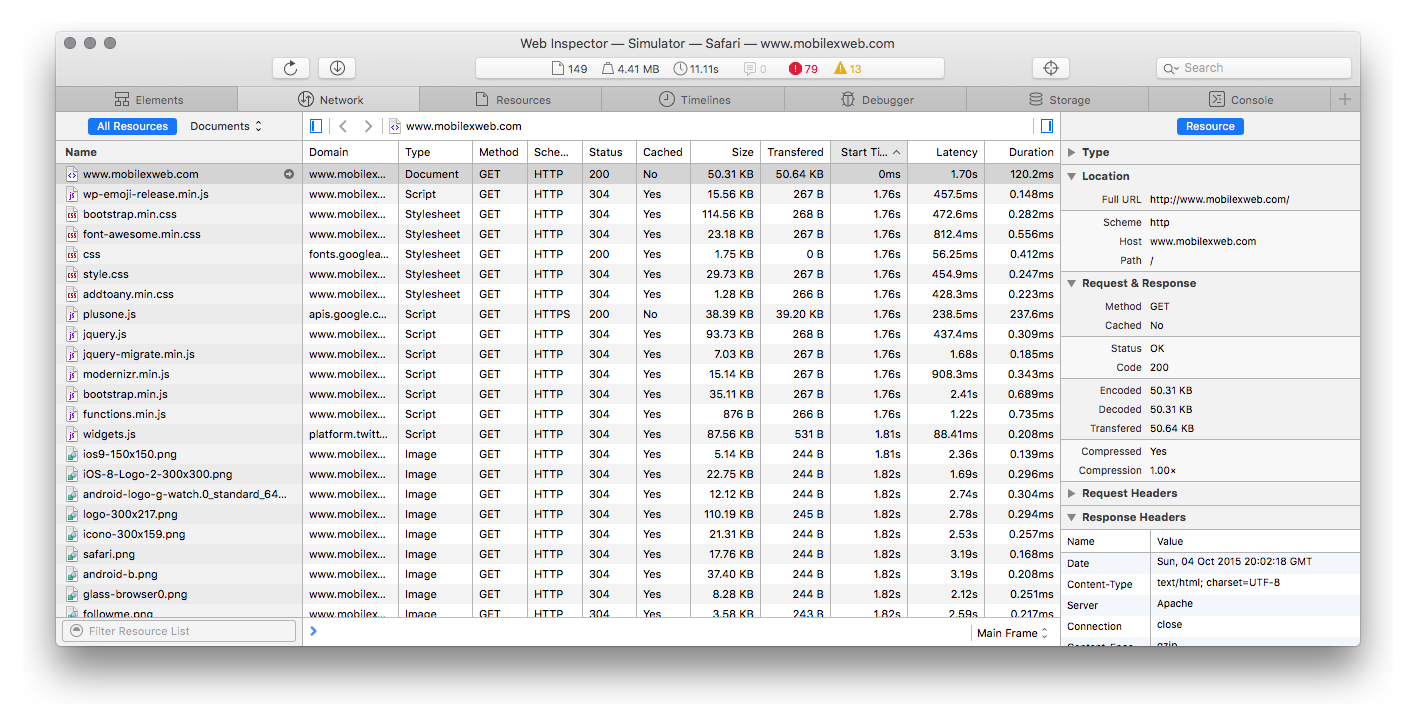
The section of the Web Inspector that matters to web performance is the Timelines tab, though we can also get useful information from the Network tab. There is a record button at the top left of the screen that we can use to start profiling a website or web app.
Its better to stop the recording after you have collected the information youre looking for, such as after the page has loaded. Itll help the analysis of the results if the timeline is static (not changing, and not adding more items while recording).
There are three timelines available, providing information about different areas:
Network requestsAll the network communication, including initial loading, lazy resources, and other calls after the onload event.
All the paint, layout, and CSS operations
JavaScript & EventsJavaScript code being executed by the runtime, as well as events being fired by the DOM
While we can make do with only using the analysis from the iOS Simulator, its always a good idea to check real performance on actual devices. Some features, such as real cellular network conditions or touch feedback, can only be experienced with actual phones or tablets.
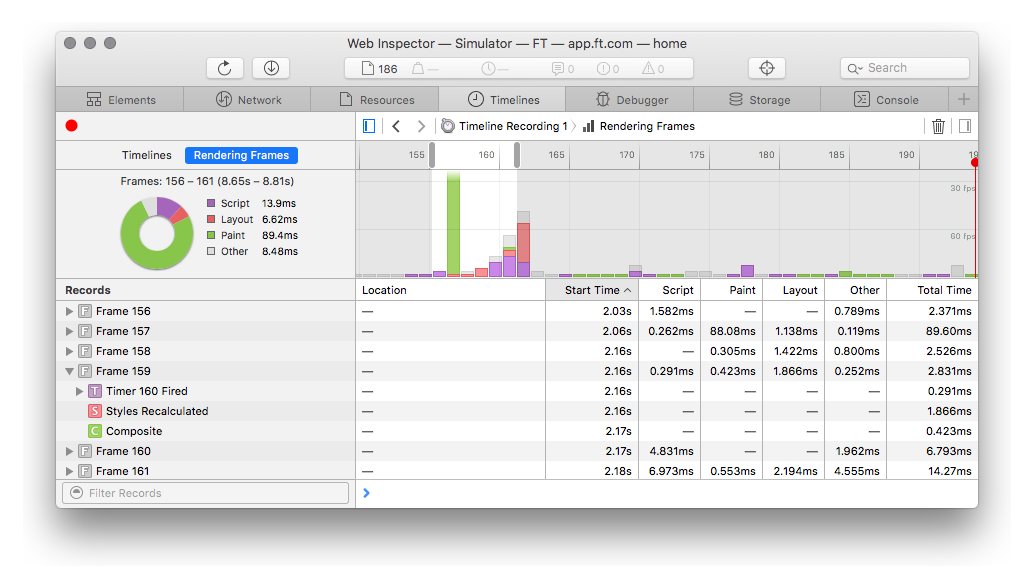
Once you have a recording dump on the screen, you will find several colored bars over the timeline. If you scroll up or down (using the mouse wheel or a touchpad gesture) over the timeline, you will be able to zoom in or out in the timeline.
If you select a region in the timeline, you will see a detail view in the lower section of the screen. Each row will represent one entry (e.g., one downloaded resource or one paint operation).
You can filter the list of entries from the selected region by using the search box in the bottom-left section and/or clicking on one of the timeline names, such as Network Requests or Layout & Rendering. To remove a timeline filter, just click on the X at the right of the timelines name.
.
. We cant see them in a waterfall chart. You can filter by name, by resource type, or by document (main document or iframes available).
The iOS WebKit Debug Proxy allows you to connect an iOS device or simulator to the Google Chrome Developer Tools on macOS or Linux. It acts as an experimental proxy translating Apple WebKits debugging protocol to the one that is used by Chrome. A Windows version has been ported, and Firefox also has its own solution based on these proxies that enables you to use Firefox Developer Tools with iOS, known as Valence.
Font size:
Interval:
Bookmark:
Similar books «Measurement tools for high performance»
Look at similar books to Measurement tools for high performance. We have selected literature similar in name and meaning in the hope of providing readers with more options to find new, interesting, not yet read works.
Discussion, reviews of the book Measurement tools for high performance and just readers' own opinions. Leave your comments, write what you think about the work, its meaning or the main characters. Specify what exactly you liked and what you didn't like, and why you think so.