Part I
Cluster and Classification Models
Springer International Publishing Switzerland 2015
Ton J. Cleophas and Aeilko H. Zwinderman Machine Learning in Medicine - a Complete Overview 10.1007/978-3-319-15195-3_1
1. Hierarchical Clustering and K-Means Clustering to Identify Subgroups in Surveys (50 Patients)
Ton J. Cleophas 1 and Aeilko H. Zwinderman 2
(1)
Department Medicine, Albert Schweitzer Hospital, Sliedrecht, The Netherlands
(2)
Department Biostatistics and Epidemiology, Academic Medical Center, Amsterdam, The Netherlands
This chapter was previously published in Machine learning in medicine-cookbook 1 as Chap. 1, 2013.
General Purpose
Clusters are subgroups in a survey estimated by the distances between the values needed to connect the patients, otherwise called cases. It is an important methodology in explorative data mining.
Specific Scientific Question
In a survey of patients with mental depression of different ages and depression scores, how do different clustering methods perform in identifying so far unobserved subgroups.
| | |
20,00 | 8,00 | |
21,00 | 7,00 | |
23,00 | 9,00 | |
24,00 | 10,00 | |
25,00 | 8,00 | |
26,00 | 9,00 | |
27,00 | 7,00 | |
28,00 | 8,00 | |
24,00 | 9,00 | |
32,00 | 9,00 | |
30,00 | 1,00 | |
40,00 | 2,00 | |
50,00 | 3,00 | |
60,00 | 1,00 | |
70,00 | 2,00 | |
76,00 | 3,00 | |
65,00 | 2,00 | |
54,00 | 3,00 | |
Var 1 age
Var 2 depression score (0=very mild, 10=severest)
Var 3 patient number (called cases here)
Only the first 18 patients are given, the entire data file is entitled hierk-meansdensity and is in extras.springer.com.
Hierarchical Cluster Analysis
SPSS 19.0 will be used for data analysis. Start by opening the data file.
Command:
Analyze.Classify.Hierarchical Cluster Analysis.enter variables.Label Case by: case variable with the values 1-50.Plots: mark Dendrogram.Method
.Cluster Method: Between-group linkage.Measure: Squared Euclidean Distance.Save: click Single solution.Number of clusters: enter 3.Continue .OK.
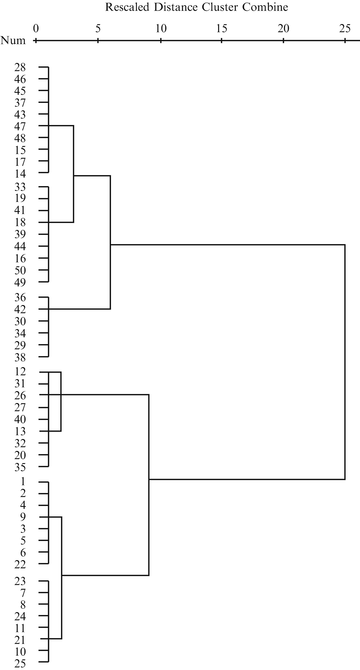
In the output a dendrogram of the results is given. The actual distances between the cases are rescaled to fall into a range of 025 units (0=minimal distance, 25=maximal distance). The cases no. 111, 2125 are clustered together in cluster 1, the cases 12, 13, 20, 26, 27, 31, 32, 35, 40 in cluster 2, both at a rescaled distance from 0 at approximately 3 units, the remainder of the cases is clustered at approximately 6 units. And so, as requested, three clusters have been identified with cases more similar to one another than to the other clusters. When minimizing the output, the data file comes up and it now shows the cluster membership of each case. We will use SPSS again to draw a Dotter graph of the data.
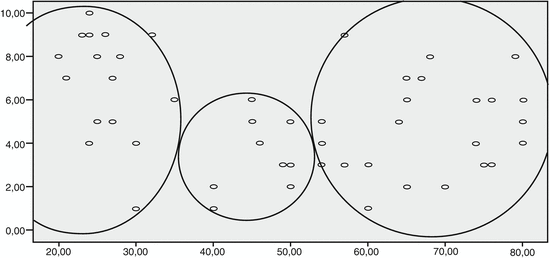
The graph (with age on the x-axis and severity score on the y-axis) produced by SPSS shows the cases. Using Microsofts drawing commands we can encircle the clusters as identified. All of them are oval and even, approximately, round, because variables have similar scales, but they are different in size.
K-Means Cluster Analysis
The output shows that the three clusters identified by the k-means cluster model were significantly different from one another both by testing the y-axis (depression score) and the x-axis variable (age). When minimizing the output sheets, the data file comes up and shows the cluster membership of the three clusters.
ANOVA |
|---|
Cluster | Error |
Mean square | df | Mean square | df | F | Sig. |
Age | 8712,723 | | 31,082 | | 280,310 | ,000 |
Depression score | 39,102 | | 4,593 | | 8,513 | ,001 |
We will use SPSS again to draw a Dotter graph of the data.
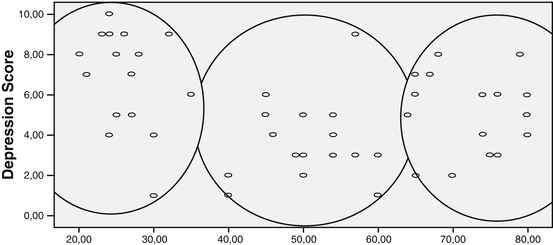
The graph (with age on the x-axis and severity score on the y-axis) produced by SPSS shows the cases. Using Microsofts drawing commands we can encircle the clusters as identified. All of them are oval and even approximately round because variables have similar scales, and they are approximately equal in size.
Conclusion
Clusters are estimated by the distances between the values needed to connect the cases. It is an important methodology in explorative data mining. Hierarchical clustering is adequate if subgroups are expected to be different in size, k-means clustering if approximately similar in size. Density-based clustering is more appropriate if small outlier groups between otherwise homogenous populations are expected. The latter method is in Chap..
Note
More background, theoretical and mathematical information of the two methods is given in Machine learning in medicine part two, Chap. 8 Two-dimensional Clustering, pp 6575, Springer Heidelberg Germany 2013. Density-based clustering will be reviewed in the next chapter.

