• Complain

Cleophas Ton J. M. - SPSS for Starters and 2nd Levelers

Here you can read online Cleophas Ton J. M. - SPSS for Starters and 2nd Levelers full text of the book (entire story) in english for free. Download pdf and epub, get meaning, cover and reviews about this ebook. City: Cham, year: 2016;2015, publisher: Springer, genre: Computer. Description of the work, (preface) as well as reviews are available. Best literature library LitArk.com created for fans of good reading and offers a wide selection of genres:

Romance novel Science fiction Adventure Detective Science History Home and family Prose Art Politics Computer Non-fiction Religion Business Children Humor

Choose a favorite category and find really read worthwhile books. Enjoy immersion in the world of imagination, feel the emotions of the characters or learn something new for yourself, make an fascinating discovery.

Cleophas Ton J. M. SPSS for Starters and 2nd Levelers

SPSS for Starters and 2nd Levelers: summary, description and annotation

We offer to read an annotation, description, summary or preface (depends on what the author of the book "SPSS for Starters and 2nd Levelers" wrote himself). If you haven't found the necessary information about the book — write in the comments, we will try to find it.

Preface.- Introduction -- I Continuous outcome data -- One sample continuous data -- Paired continuous outcome data normality assumed -- Paired continuous outcome data nonnormality accounted -- Paired continuous outcome data with predictors -- Unpaired continuous outcome data normality assumed -- Unpaired continuous outcome data nonnormality accounted -- Linear regression for continuous outcome data -- Recoding for categorical predictor data -- Repeated-measures-analysis of variance normality assumed.- Repeated-measures-analysis of variance nonnormality accounted -- Doubly-repeated-measures-analysis of variance -- Multilevel modeling with mixed linear models. Random multilevel modeling with generalized mixed linear models -- One-way-analysis of variance normality assumed -- One-way-analysis of variance nonnormality accounted -- Trend tests of continuous outcome data -- Multistage regression -- Multivariate analysis with path statistics -- Multivariate analysis of variance.- Average-rank-testing for multiple outcome variables and categorical predictors -- Missing data imputation -- Meta-regression -- Poisson regression including a weight variable (time of observation) for rates -- Confounding -- Interaction -- Curvilinear analysis -- Loess and spline modeling for nonlinear data, where curvilinear models lack fit -- Monte Carlo analysis, the easy alternative for continuous outcome data -- Artificial intelligence as a distribution free alternative for nonlinear data -- Robust tests for d ata with large outliers -- Nonnegative outcome data using the gamma distribution -- Nonnegative outcome data with a big spike at zero using the Tweedie distribution -- Polynomial analysis for continuous outcome data with a sinusoidal pattern -- Validating quantitative diagnostic tests -- Reliability assessment of quantitative diagnostic tests -- II Binary outcome data -- One sample binary data -- Unpaired binary data -- Binary logistic regression with a binary predictor -- Binary logistic regression with categorical predictors -- Binary logistic regression with a continuous predictor -- Trend tests of binary data -- Paired binary outcome data without predictors -- Paired binary outcome data with predictors -- Repeated measures binary data -- Multinomial logistic regression for outcome categories -- Multinomial logistic regression with random intercepts for both categorical outcome and predictor data -- Comparing the performance of diagnostic tests -- Poisson regression for binary outcome data -- Loglinear models for the exploration of multidimensional contingency tables -- Probit regression for binary outcome data reported as response rates -- Monte Carlo analysis, the easy alternative for binary outcomes -- Validating qualitative diagnostic tests -- Reliability assessment of qualitative diagnostic tests. III Survival and longitudinal data -- Log rank tests -- Cox regression -- Cox regression with time-dependent variables -- Segmented Cox regression -- Assessing seasonality -- Probability assessment of survival with interval censored data analysis -- Index.;For medical and health workers this book is a must-have, because statistical methods in these fields are vital, and no equivalent work is available. For medical and health students this is equally true. A unique point is its low threshold, textually simple and at the same time full of self-assessment opportunities. Other unique points are the succinctness of the chapters with 3 to 6 pages, the presence of entire-commands-texts of the statistical methodologies reviewed, and the fact that dull scientific texts imposing an unnecessary burden on busy and jaded professionals have been left out. For readers requesting more background, theoretical and mathematical information a note section with references is in each chapter. The first edition in 2010 was the first publication of a complete overview of SPSS methodologies for medical and health statistics. Well over 100,000 copies of various chapters were sold within the first year of publication. Reasons for a rewrite were four. First, many important comments from readers urged for a rewrite. Second, SPSS has produced many updates and upgrades, with relevant novel and improved methodologies. Third, the authors felt that the chapter texts needed some improvements for better readability: chapters have now been classified according the outcome data helpful for choosing your analysis rapidly, a schematic overview of data, and explanatory graphs have been added. Fourth, current data are increasingly complex and many important methods for analysis were missing in the first edition. For that latter purpose some more advanced methods seemed unavoidable, like hierarchical loglinear methods, gamma and Tweedie regressions, and random intercept analyses. In order for the contents of the book to remain covered by the title, the authors renamed the book: SPSS for Starters and 2nd Levelers. Special care was, nonetheless, taken to keep things as simple as possible. Medical and health professionals tend to dislike software syntax. Therefore, virtually no syntax, but, rather, simple menu commands are given. The arithmetic is still of a no-more-than high-school level. Step-by-step analyses of different statistical methodologies are given with the help of 60 SPSS data files available through the internet. Because of the lack of time of this busy group of people, the authors have given every effort to produce a text as succinct as possible.

Cleophas Ton J. M.: author's other books


Who wrote SPSS for Starters and 2nd Levelers? Find out the surname, the name of the author of the book and a list of all author's works by series.

SPSS for Starters and 2nd Levelers — read online for free the complete book (whole text) full work

Below is the text of the book, divided by pages. System saving the place of the last page read, allows you to conveniently read the book "SPSS for Starters and 2nd Levelers" online for free, without having to search again every time where you left off. Put a bookmark, and you can go to the page where you finished reading at any time.

Light

Font size:

Reset

Interval:

Bookmark:

Make
Part I
Continuous Outcome Data
Springer International Publishing Switzerland 2016
Ton J. Cleophas and Aeilko H. Zwinderman SPSS for Starters and 2nd Levelers 10.1007/978-3-319-20600-4_1
1. One-Sample Continuous Data (One-Sample T-Test, One-Sample Wilcoxon Signed Rank Test, 10 Patients)
Ton J. Cleophas 1, 2 and Aeilko H. Zwinderman 2, 3
(1)
Department Medicine, Albert Schweitzer Hospital, Dordrecht, The Netherlands
(2)
European College Pharmaceutical Medicine, Lyon, France
(3)
Department Biostatistics, Academic Medical Center, Amsterdam, The Netherlands
General Purpose
Because biological processes are full of variations, statistical tests give no certainties, only chances. Particularly, the chance that a prior hypothesis is true. What hypothesis? Often, a nullhypothesis, which means no difference in your data from a zero effect. A zero effect indicates that a factor, like an intervention or medical treatment does not have any effect. The one sample t-test is adequate for assessment.
Schematic Overview of Type of Data File
Primary Scientific Question Is the mean outcome value significantly different - photo 1
Primary Scientific Question
Is the mean outcome value significantly different from the value zero.
Data Example
The reduction of mean blood pressure after treatment is measured in a sample of patients. We wish to know whether the mean reduction is significantly larger than zero.
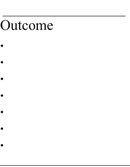
  • Outcome
  • outcome=decrease of mean blood pressure after treatment (mm Hg)
Analysis: One-Sample T-Test
The data file is in extras.springer.com, and is entitled chapter1onesamplecontinuous. Open it in SPSS . For analysis the module Compare Means is required. It consists of the following statistical models:
  • Means,
  • One-Sample T-Test ,
  • Independent-Samples T-Test,
  • Paired-Samples T-Test and
  • One Way ANOVA
Command:
  • Analyze....Compare Means ....One-Sample T-Test ....Test Variable(s): enter "mean blood pressure reduction"....click OK.
In the output sheets is the underneath table.
One-sample test
Test value = 0
t
df
Sig. (2-tailed)
Mean difference
95 % confidence interval of the difference
Lower
Upper
VAR00001
2,429
,038
1,70000
,1165
3,2835
It shows that the t-value equals 2,429, which means that with 101=9 degrees of freedom a significant effect is obtained at p=0,038. The reduction of mean blood pressure has an average value of 1,7000 mm Hg, and this average reduction is significantly larger than a reduction of 0,00 mm Hg.
Alternative Analysis: One-Sample Wilcoxon Signed Rank Test
If the data do not follow a Gaussian distribution, this method will be required, but with Gaussian distributions it may be applied even so.
Command:
  • Analyze....Nonparametric tests....One Sample Nonparametric Test s ....click Fields ....Test Fields: enter "mean blood pressure reduction"....click Settings....click Choose Tests....mark Customize Tests....mark Compare median to hypothesized ....Hypothesized median: type "0,00"....click Run.
The underneath table is in the output sheet. The median of the mean blood pressure reductions is significantly different from zero. The treatment is, obviously, successful. The p-value is very similar to that of the above one sample t-test .
Hypotheses test summary
Asymptotic significances are displayed The significance level is 05 - photo 2
Asymptotic significances are displayed. The significance level is ,05
Conclusion
The significant effects indicate that the nullhypothesis of no effect can be rejected. The treatment performs better than no treatment. It may be prudent to use non-parametric test s , if normality is doubtful or can not be proven like with small data as those in the current example.
Note
The theories of null hypotheses and frequency distributions are reviewed in Statistics applied to clinical studies 5th edition, Chaps. 1 and 2, entitled Hypotheses data stratification and The analysis of efficacy data, Springer Heidelberg Germany, 2012, from the same authors.
Springer International Publishing Switzerland 2016
Ton J. Cleophas and Aeilko H. Zwinderman SPSS for Starters and 2nd Levelers 10.1007/978-3-319-20600-4_2
2. Paired Continuous Data (Paired T-Test, Wilcoxon Signed Rank Test, 10 Patients)
Ton J. Cleophas 1, 2 and Aeilko H. Zwinderman 2, 3
(1)
Department Medicine, Albert Schweitzer Hospital, Dordrecht, The Netherlands
(2)
European College Pharmaceutical Medicine, Lyon, France
(3)
Department Biostatistics, Academic Medical Center, Amsterdam, The Netherlands
General Purpose
Studies where two outcomes in one patient are compared with one another are often called crossover studies, and the observations are called paired observations.
As paired observations are usually more similar than unpaired observations, special tests are required in order to adjust for a positive correlation between the paired observations.
Schematic Overview of Type of Data File
Primary Scientific Question Is the first outcome significantly different from - photo 3
Primary Scientific Question
Is the first outcome significantly different from second one.
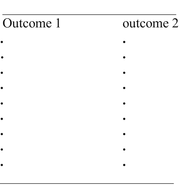
Data Example
The underneath study assesses whether some sleeping pill is more efficaceous than a placcebo. The hours of sleep is the outcome value.
Outcome 1
Outcome 2
6,1
5,2
7,0
7,9
8,2
3,9
7,6
4,7
6,5
5,3
8,4
5,4
6,9
4,2
6,7
6,1
7,4
3,8
5,8
6,3
Outcome=hours of sleep after treatment
Analysis: Paired T-Test
The data file is in extras.springer.com and is entitled chapter2pairedcontinuous. Open it in SPSS. We will start with a graph of the data.
Command:
  • Graphs....Bars....mark Summary separate variables....Define....Bars Represent: enter "hours of sleep [outcomeone]"....enter "hours of sleep [outcometwo]"....click Options....mark Display error bars....mark Confidence Intervals....Level (%): enter 95,0....Continue....click OK.
Next page
Light

Font size:

Reset

Interval:

Bookmark:

Make

Similar books «SPSS for Starters and 2nd Levelers»

Look at similar books to SPSS for Starters and 2nd Levelers. We have selected literature similar in name and meaning in the hope of providing readers with more options to find new, interesting, not yet read works.


Reviews about «SPSS for Starters and 2nd Levelers»

Discussion, reviews of the book SPSS for Starters and 2nd Levelers and just readers' own opinions. Leave your comments, write what you think about the work, its meaning or the main characters. Specify what exactly you liked and what you didn't like, and why you think so.