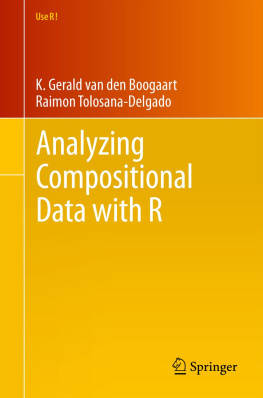
Tolosana-Delgado Raimon - Analyzing Compositional Data with R
Here you can read online Tolosana-Delgado Raimon - Analyzing Compositional Data with R full text of the book (entire story) in english for free. Download pdf and epub, get meaning, cover and reviews about this ebook. City: Berlin;Heidelberg, year: 2013, publisher: Springer, genre: Computer. Description of the work, (preface) as well as reviews are available. Best literature library LitArk.com created for fans of good reading and offers a wide selection of genres:
Romance novel
Science fiction
Adventure
Detective
Science
History
Home and family
Prose
Art
Politics
Computer
Non-fiction
Religion
Business
Children
Humor
Choose a favorite category and find really read worthwhile books. Enjoy immersion in the world of imagination, feel the emotions of the characters or learn something new for yourself, make an fascinating discovery.
- Book:Analyzing Compositional Data with R
- Author:
- Publisher:Springer
- Genre:
- Year:2013
- City:Berlin;Heidelberg
- Rating:4 / 5
- Favourites:Add to favourites
- Your mark:
- 80
- 1
- 2
- 3
- 4
- 5
Analyzing Compositional Data with R: summary, description and annotation
We offer to read an annotation, description, summary or preface (depends on what the author of the book "Analyzing Compositional Data with R" wrote himself). If you haven't found the necessary information about the book — write in the comments, we will try to find it.
Analyzing Compositional Data with R — read online for free the complete book (whole text) full work
Below is the text of the book, divided by pages. System saving the place of the last page read, allows you to conveniently read the book "Analyzing Compositional Data with R" online for free, without having to search again every time where you left off. Put a bookmark, and you can go to the page where you finished reading at any time.
Font size:
Interval:
Bookmark:
- Independent components mixed together and closed exhibit negative correlations (Chayes, ).This negative bias contradicts the usual interpretations of correlation and covariance, where independence is usually related to zero correlation.
- Covariance between two components depends on which other components are reported in the dataset.This disqualifies classical covariance-based tools as objective descriptions of the dependence between just two variables. This is particularly important whenever there is no single, unique, objective choice of the components to include in the composition, because each analyst could reasonably take a different set of components (including the two for which the covariance is computed) and each would get a different covariance estimate, even with different signs. The same comment applies to correlation: this is known as the spurious correlation problem.
- Variance matrices are always singular due to the constant sum constraints.Many multivariate statistical methods rely on a full-rank variance matrix, like multivariate linear models, Mahalanobis distances, factor analysis, minimum determinant variance estimators, multivariate Z-transforms, multivariate densities, linear and quadratic discriminant analysis, and Hotellings T 2 distribution. None will be directly applicable.
- Components cannot be normally distributed, due to the bounded range of values.Many multivariate methods are at least motivated by multivariate normal distributions: covariance matrices, confidence ellipsoids, and principal component analysis are some examples. The normal model is a bad one for (untransformed) compositions, because it is a model unable to describe bounded data.
- When compositional data are actually measured, we often have little control over the total amount.A probe of the patients blood, a sample of geological formation, a national economy, or the workforce of a company: in any of these cases, the total size of each individual sample is either irrelevant (the country population, the size of the rock sample, or the enterprise) or predefined (the syringe volume).
- Often the amounts are incompletely given and do not sum up to the real total.Some species of a biological system cannot be caught in traps; we never quantify all possible chemical elements in a rock; we cannot analyze for all possible ingredients of a beverage.
- Most typically, the totals are not comparable between the different statistical individuals.
Font size:
Interval:
Bookmark:
Similar books «Analyzing Compositional Data with R»
Look at similar books to Analyzing Compositional Data with R. We have selected literature similar in name and meaning in the hope of providing readers with more options to find new, interesting, not yet read works.
Discussion, reviews of the book Analyzing Compositional Data with R and just readers' own opinions. Leave your comments, write what you think about the work, its meaning or the main characters. Specify what exactly you liked and what you didn't like, and why you think so.


![EMC Education Services [EMC Education Services] - Data Science and Big Data Analytics: Discovering, Analyzing, Visualizing and Presenting Data](/uploads/posts/book/119625/thumbs/emc-education-services-emc-education-services.jpg)