Data Analytics with Excel
Punit Prabhu
Copyright 2021 Punit Prabhu
All rights reserved
The characters and events portrayed in this book are fictitious. Any similarity to real persons, living or dead, is coincidental and not intended by the author.
No part of this book may be reproduced, or stored in a retrieval system, or transmitted in any form or by any means, electronic, mechanical, photocopying, recording, or otherwise, without express written permission of the publisher.
Contents
Introduction to Data Analytics
What is Data Analytics?
Data Analytics is the process of exploring and analyzing large data sets to help data driven decision making.
Analyze Data
Decision Making
Definition
Data when suitably filtered and analysed along with other related Data
Sources and a suitable Analytics applied can provide valuable information to various organizations, industries, business, etc. in
the form of prediction, recommendation, decision and the like.
Applications of Data Analytics
Finance & Accounting, Business analytics, Fraud , Healthcare, Information Technology, Insurance, Taxation , Internal Audit, Digital forensic, Transportation, Food, Delivery, FMCG, Planning of cities, Expenditure, Risk management, Risk detection, Security, Travelling, Managing Energy, Internet searching, Digital advertisement , etc.
Real life examples of Data Analytics
Coca-Cola
Coca Cola uses big data analytics to drive customer retention.

In the year 2015, Coca-Cola managed to strengthen its data strategy by building a digital-led loyalty program. According to a Forbes article, Coca Cola was one of the first globally recognized brands, outside of the tech sector, to embrace Big Data. In 2015, for example, they were able to determine that Coca Cola products were mentioned online once every two seconds. Having access to this information helps them understand who their customers are, where they live, and what prompts them to discuss the brand.
Netflix

Netflix is a good example of a big brand that uses big data analytics for targeted advertising. With over 100 million subscribers, the company collects huge data, which is the key to achieving the industry status.If you are a subscriber, you are familiar to how they send you suggestions of the next movie you should watch. Basically, this is done using your past search and watch data. This data is used to give them insights on what interests the subscriber most. See the screenshot below showing how Netflix gathers big data.
UOB Bank

UOB bank from Singapore is an example of a brand that uses big data to drive risk management. Being a financial institution, there is huge potential for incurring losses if risk management is not well thought of. UOB bank recently tested a risk management system that is based on big data. The big data risk management system enables the bank to reduce the calculation time of the value at risk. Initially, it took about 18 hours, but with the risk management system that uses big data, it only takes a few minutes. Through this initiative, the bank will possibly be able to carry out real-time risk analysis in the near future.
Amazon Fresh and Whole Foods

Amazon leverages big data analytics to move into a large market. The data-driven logistics gives Amazon the required expertise to enable creation and achievement of greater value. Focusing on big data analytics, Amazon whole foods is able to understand how customers buy groceries and how suppliers interact with the grocer. This data gives insights whenever there is need to implement further changes.
Pepsico

PepsiCo is a consumer packaged goods company that relies on huge volumes of data for an efficient supply chain management. The company is committed to ensuring they replenish the retailers shelves with appropriate volumes and types of products. The companys clients provide reports that include their warehouse inventory and the POS inventory to the company, and this data is used to reconcile and forecast the production and shipment needs. This way, the company ensures retailers have the right products, in the right volumes and at the right time. Listen to this webinar where the companys Customer Supply Chain Analyst talks about the importance of big data analytics in PepsiCo Supply chain.
Data Analytics with Excel and Power BI
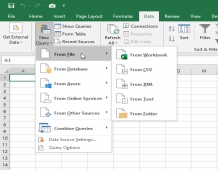
Excel and Power Bi are powerful, flexible tools for every analytics activity. Both can be used to get broad data analytics and visualization capabilities. We can easily gather, shape, analyze, and explore key business data in new waysall in less timeusing both apps together.
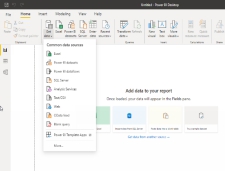
Data analytics in Excel and Power is done by Importing the data from various sources and linking it with excel and power bi, cleaning and transform the data, manipulate and analyze the data using visuals.
Introduction of Software to be used in the course
- MS Office Tools Excel, Word, Power Point
- Microsoft Excel
Basics of Excel
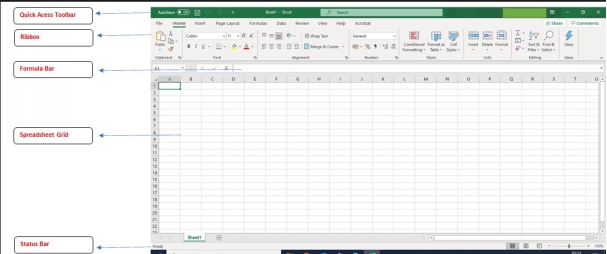
There are 5 important areas in the screen.
Quick Access Toolbar: This is a place where all the important tools can be placed. When you start Excel for the very first time, it has only 3 icons (Save, Undo, Redo). But you can add any feature of Excel to to Quick Access Toolbar so that you can easily access it from anywhere (hence the name).
Ribbon: Ribbon is like an expanded menu. It depicts all the features of Excel in easy to understand form. Since Excel has 1000s of features, they are grouped in to several ribbons. The most important ribbons are Home, Insert, Formulas, Page Layout & Data.
Formula Bar: This is where any calculations or formulas you write will appear. You will understand the relevance of it once you start building formulas.
4. Spreadsheet Grid: This is where all your numbers, data, charts & drawings will go. Each Excel file can contain several sheets. But the spreadsheet grid shows few rows & columns of active spreadsheet. To see more rows or columns you can use the scroll bars to the left or at bottom. If you want to access other sheets, just click on the sheet name (or use the shortcut CTRL+Page Up or CTRL+Page Down).





 In the year 2015, Coca-Cola managed to strengthen its data strategy by building a digital-led loyalty program. According to a Forbes article, Coca Cola was one of the first globally recognized brands, outside of the tech sector, to embrace Big Data. In 2015, for example, they were able to determine that Coca Cola products were mentioned online once every two seconds. Having access to this information helps them understand who their customers are, where they live, and what prompts them to discuss the brand.
 Netflix is a good example of a big brand that uses big data analytics for targeted advertising. With over 100 million subscribers, the company collects huge data, which is the key to achieving the industry status.If you are a subscriber, you are familiar to how they send you suggestions of the next movie you should watch. Basically, this is done using your past search and watch data. This data is used to give them insights on what interests the subscriber most. See the screenshot below showing how Netflix gathers big data.
 UOB bank from Singapore is an example of a brand that uses big data to drive risk management. Being a financial institution, there is huge potential for incurring losses if risk management is not well thought of. UOB bank recently tested a risk management system that is based on big data. The big data risk management system enables the bank to reduce the calculation time of the value at risk. Initially, it took about 18 hours, but with the risk management system that uses big data, it only takes a few minutes. Through this initiative, the bank will possibly be able to carry out real-time risk analysis in the near future.
 Amazon leverages big data analytics to move into a large market. The data-driven logistics gives Amazon the required expertise to enable creation and achievement of greater value. Focusing on big data analytics, Amazon whole foods is able to understand how customers buy groceries and how suppliers interact with the grocer. This data gives insights whenever there is need to implement further changes.
 PepsiCo is a consumer packaged goods company that relies on huge volumes of data for an efficient supply chain management. The company is committed to ensuring they replenish the retailers shelves with appropriate volumes and types of products. The companys clients provide reports that include their warehouse inventory and the POS inventory to the company, and this data is used to reconcile and forecast the production and shipment needs. This way, the company ensures retailers have the right products, in the right volumes and at the right time. Listen to this webinar where the companys Customer Supply Chain Analyst talks about the importance of big data analytics in PepsiCo Supply chain.
 Data Analytics with Excel and Power BI
 Data analytics in Excel and Power is done by Importing the data from various sources and linking it with excel and power bi, cleaning and transform the data, manipulate and analyze the data using visuals.