Michael N. Mitchell - A visual guide to Stata graphics
Here you can read online Michael N. Mitchell - A visual guide to Stata graphics full text of the book (entire story) in english for free. Download pdf and epub, get meaning, cover and reviews about this ebook. year: 2022, genre: Computer. Description of the work, (preface) as well as reviews are available. Best literature library LitArk.com created for fans of good reading and offers a wide selection of genres:
Romance novel
Science fiction
Adventure
Detective
Science
History
Home and family
Prose
Art
Politics
Computer
Non-fiction
Religion
Business
Children
Humor
Choose a favorite category and find really read worthwhile books. Enjoy immersion in the world of imagination, feel the emotions of the characters or learn something new for yourself, make an fascinating discovery.
- Book:A visual guide to Stata graphics
- Author:
- Genre:
- Year:2022
- Rating:3 / 5
- Favourites:Add to favourites
- Your mark:
A visual guide to Stata graphics: summary, description and annotation
We offer to read an annotation, description, summary or preface (depends on what the author of the book "A visual guide to Stata graphics" wrote himself). If you haven't found the necessary information about the book — write in the comments, we will try to find it.
Michael N. Mitchell: author's other books
Who wrote A visual guide to Stata graphics? Find out the surname, the name of the author of the book and a list of all author's works by series.

A visual guide to Stata graphics — read online for free the complete book (whole text) full work
Below is the text of the book, divided by pages. System saving the place of the last page read, allows you to conveniently read the book "A visual guide to Stata graphics" online for free, without having to search again every time where you left off. Put a bookmark, and you can go to the page where you finished reading at any time.
Font size:
Interval:
Bookmark:

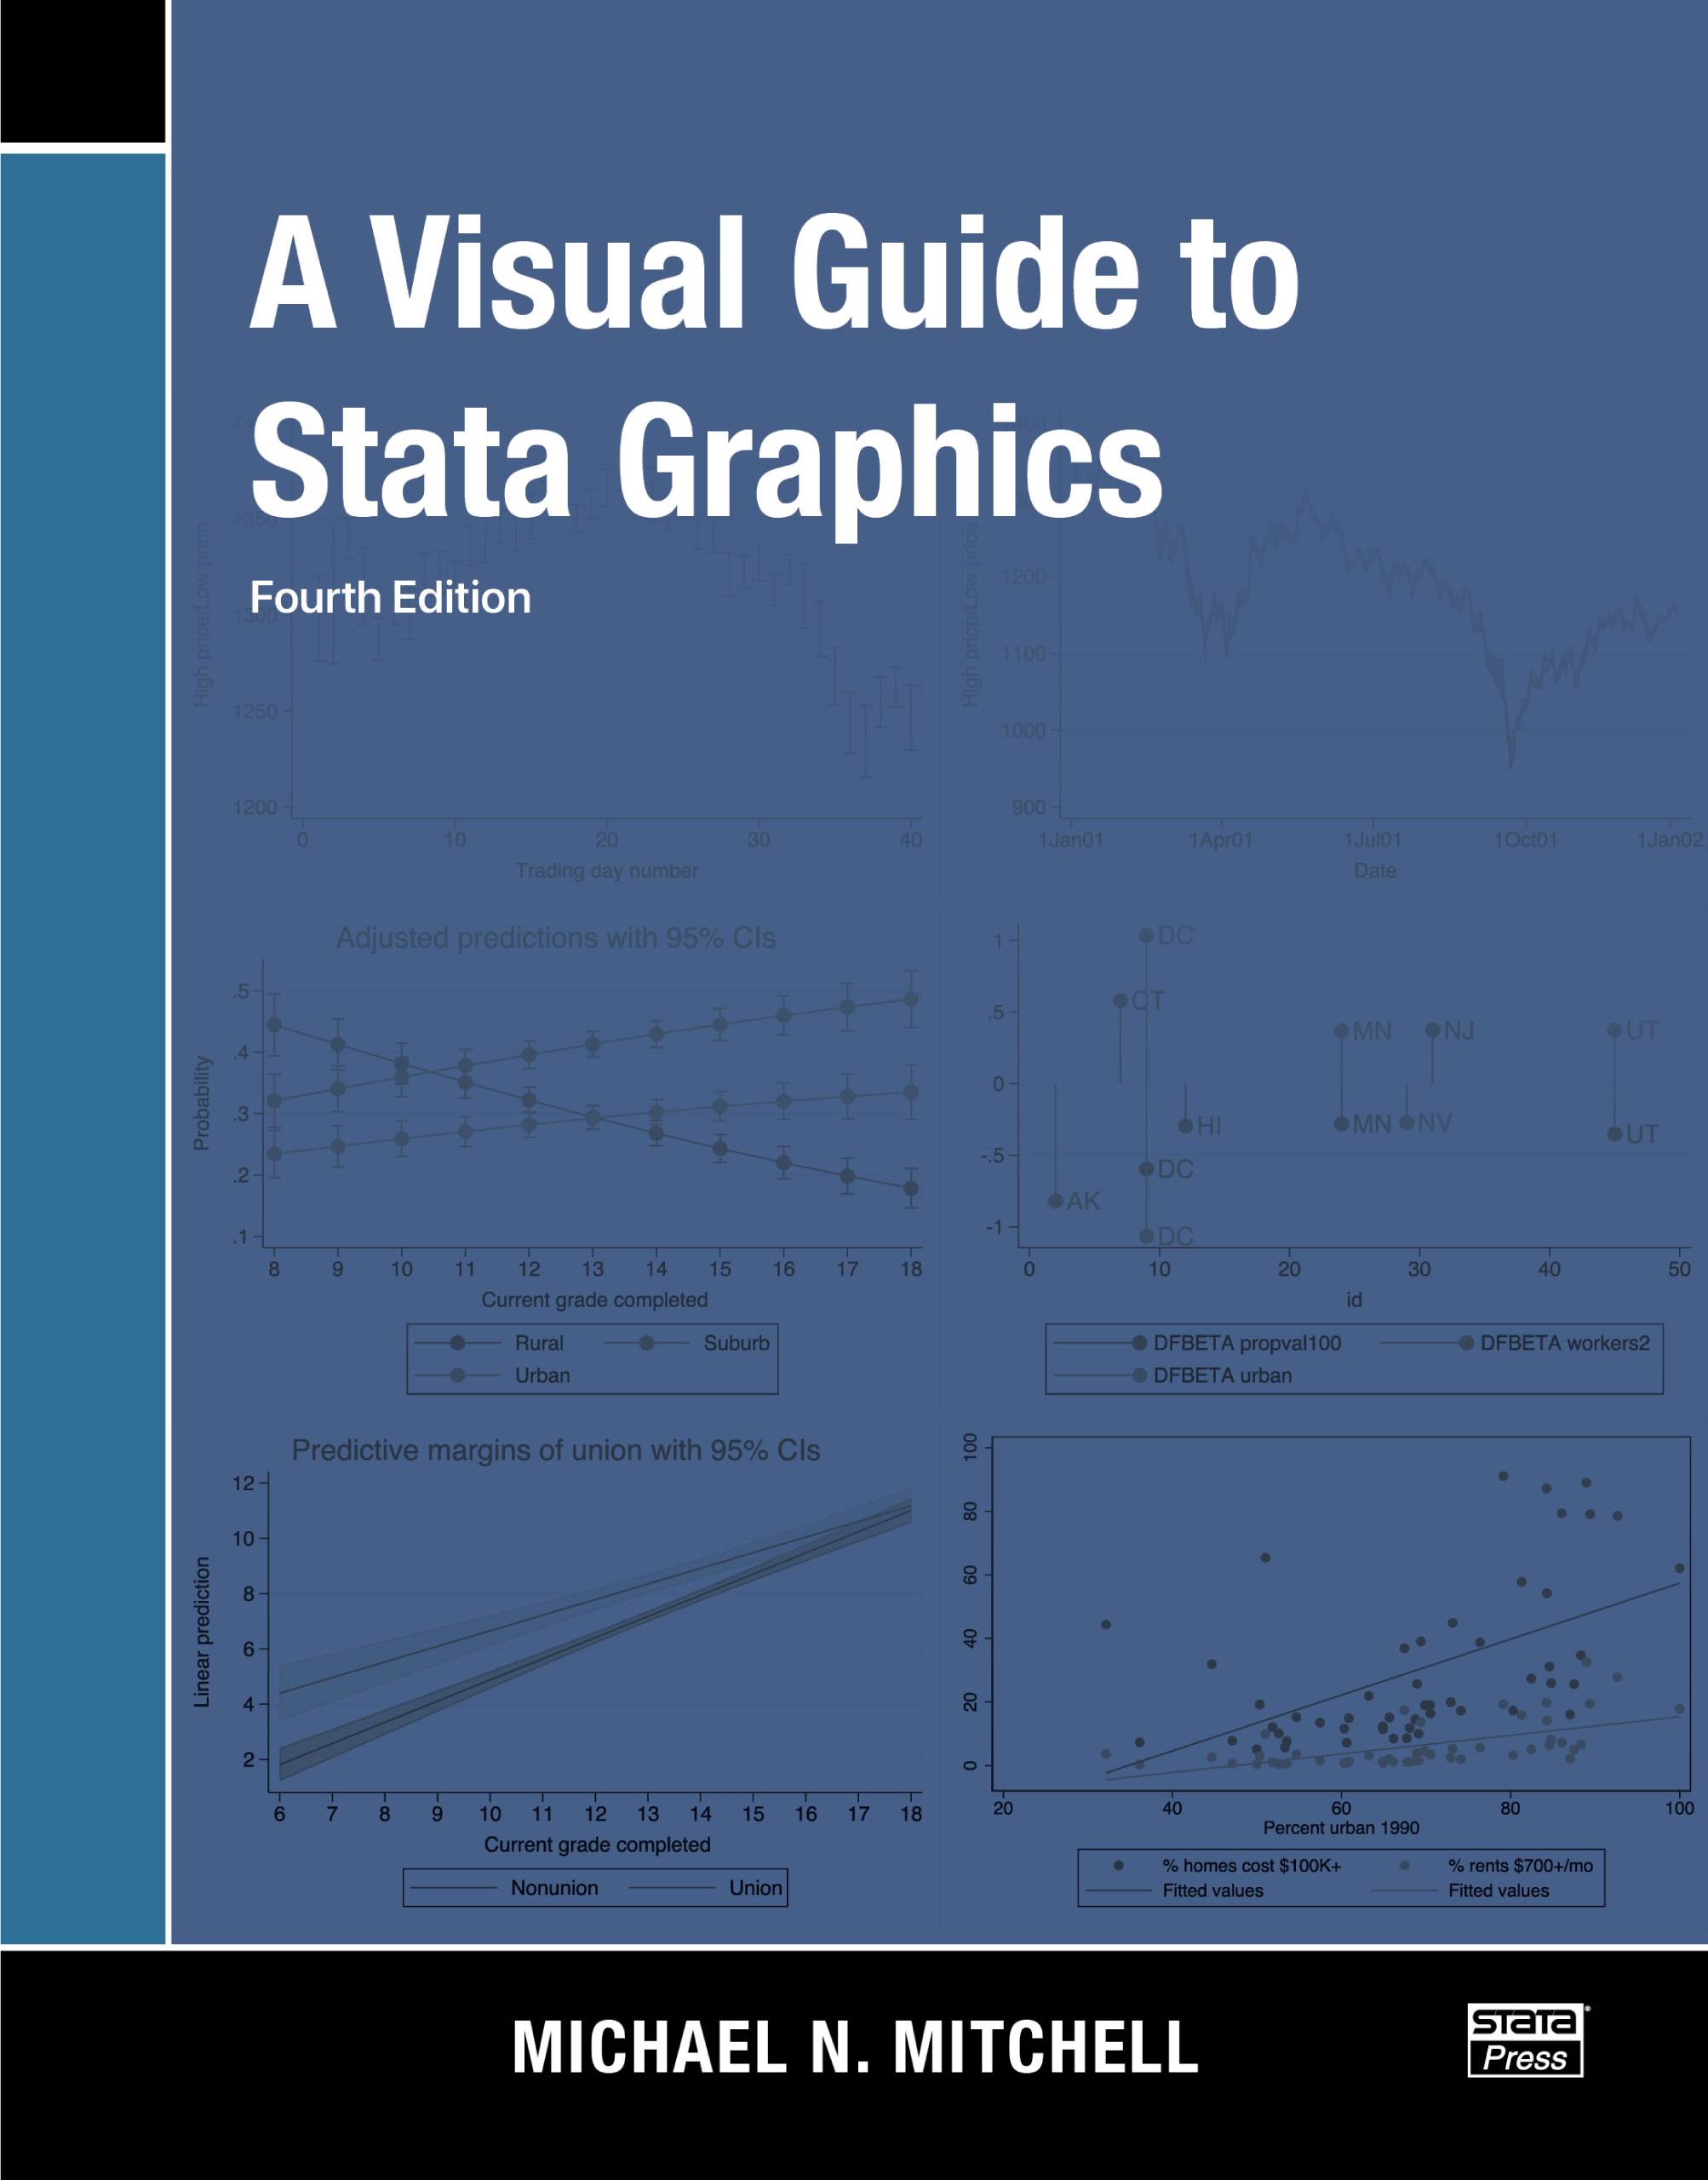
A Visual Guide to Stata Graphics
Fourth Edition
MICHAEL N. MITCHELL

![]()
A Stata Press Publication
StataCorp LLC
College Station, Texas
Copyright 2004, 2008, 2012, 2022 by StataCorp LLC
All rights reserved. First edition 2004
Second edition 2008
Third edition 2012
Fourth edition 2022
Published by Stata Press, 4905 Lakeway Drive, College Station, Texas 77845
Typeset in LaTeX2e
Printed in the United States of America
10 9 8 7 6 5 4 3 2 1
Print ISBN-10: 1-59718-365-2
Print ISBN-13: 978-1-59718-365-9
ePub ISBN-10: 1-59718-366-0
ePub ISBN-13: 978-1-59718-366-6
Library of Congress Control Number: 2021951939
No part of this book may be reproduced, stored in a retrieval system, or transcribed, in any form or by any meanselectronic, mechanical, photocopy, recording, or otherwisewithout the prior written permission of StataCorp LLC.
Stata, ![]() , Stata Press, Mata,
, Stata Press, Mata, ![]() , and NetCourse are registered trademarks of StataCorp LLC.
, and NetCourse are registered trademarks of StataCorp LLC.
Stata and Stata Press are registered trademarks with the World Intellectual Property Organization of the United Nations.
NetCourseNow is a trademark of StataCorp LLC.
LaTeX2e is a trademark of the American Mathematical Society.
Other brand and product names are registered trademarks or trademarks of their respective companies.
I dedicate this book to the teachers of the world. I have been fortunate to have been touchedby many special teachers, and I will always be grateful for what they kindly gave to me. I thank(in order of appearance) Larry Grossman, Fred Perske, Rosemary Sheridan, Donald Butler, JimTorcivia, Richard OConnell, Linda Fidell, and Jim Sidanius. These teachers all left me gifts ofknowledge and life lessons that help me every day. Even if they do not all remember me, I willalways remember them.
1.1
1.2
1.3
1.4
1.4.1
1.4.2
1.4.3
1.4.4
1.5
1.6
1.7
2.1
2.2
2.3
2.4
2.5
2.6
2.7
2.8
2.9
2.10
2.11
3.1
3.2
3.3
3.4
4.1
4.2
4.3
4.4
4.5
4.6
4.7
4.8
4.9
5.1
5.2
5.3
5.4
5.5
5.6
5.7
5.8
6.1
6.2
6.3
6.4
6.5
6.6
6.7
6.8
7.1
7.2
7.3
7.4
7.5
7.6
8.1
8.2
8.3
8.4
8.5
8.6
8.7
8.8
8.9
8.10
8.11
8.12
9.1
9.2
9.2.1
9.2.2
9.2.3
9.2.4
9.2.5
9.2.6
9.2.7
9.3
9.3.1
9.4
10.1
10.2
10.2.1
10.2.2
10.2.3
10.2.4
10.2.5
10.3
10.4
10.5
10.6
10.7
10.8
10.9
10.10
10.11
10.12
11.1
11.2
11.3
11.4
11.5
11.6
11.7
When I was writing the first edition of this book, we all pictured a book printed in black andwhite. All the other books in the Stata Press catalog were in black and white. As thebook was nearing completion, Stata Press found a printer who could print the book infull color. The book was nearly donenearly done in black and white. I took a hardswallow, and we agreed that even though it would take extra time and rethinking parts ofthe book from scratch, the book should be in color. Seeing all the features that Statahas added for supporting colors, I find it hard to imagine this book any other way.This new edition goes all in on the features that Stata offers for displaying colors. Inthe third edition, the section on color styles had five examplesthat section in thisnew edition includes over 50 examples [see Styles : Colors (section )]. Instead oftrying to explain the look of colors at different intensities and opacities, I show youcommands and graphs that illustrate different colors shown at differing intensities and usingdiffering opacities. Further, I illustrate how these options interact when regions withdifferent colors are overlaid atop each other. You can play with these examples to exploreother combinations of colors/intensities/opacities, either alone or when overlapping oneanother.
In addition to the new coverage of colors, this new edition details the methods you can use forsizing objects, showing the three ways of sizing objects using absolute units (like points, inches,and centimeters) and the three ways you can size objects using relative units (such as usingkeywords like large , multipliers of the original size like *2 , or sizes relative to the size of thegraph, like 5rs ). Each of these units is illustrated in the context of sizing differentelements, such as text [like titles, axis labels, marker labels, legends, and so on; see Styles : Textsize (section ) illustrates resizing the entiregraph and the different results you obtain when individual elements are sized using relative unitsversus absolute units.
If you have used prior editions of the book, you may notice that this edition no longer includesa chapter on the Graph Editor and that the examples focus exclusively on the use of commandsfor creating graphs. This is not a commentary about the utility of the Graph Editor, but instead areflection that this book was getting too large and that Stata has a growing libraryof video tutorials that interactively show how to create and modify graphs via theStata interface. In section , I describe the utility of the interactive point-and-click interface for creating and modifying graphs and suggest videos I think illustrate key features.
The overall look of this book is dramatically different from the prior edition. The prior editions periodically changed the schemes to introduce novelty and pizzazz and to underscore how powerful schemes are for controlling the entire look of your graph. This new edition uses one common scheme and changes the scheme only when there is a rationale for choosing one scheme over another. With schemes in mind, the heart of section Standard options : Schemes (section ) shows three different kinds of graphs, one at a time, illustrating the look of that graph using selected schemes that ship with Stata, schemes included with this book, and several schemes from the worldwide Stata community.
Writing this fourth edition book was a great pleasure, especially for the respite it gave during such difficult and turbulent times. I deeply hope that this book finds you happy, healthy, andmost of allsafe.
Ventura, California December 2021
This third edition updates the second edition of this book, reflecting new features available inStata version 12. Since version 10, Stata has added several new graphical features, including acommand for creating contour plots, options that give you greater control over the displayof text, and the ability to create graphs from the results of the margins command.Additional sections have been added to this third edition that illustrate these newfeatures.
A new section has been added that illustrates the use of the twoway contour command; see Twoway : Contour (section ).
This third edition also includes minor updates here and there to bring the text up to date foruse with Stata version 12.
Simi Valley, CaliforniaDecember 2011
Font size:
Interval:
Bookmark:
Similar books «A visual guide to Stata graphics»
Look at similar books to A visual guide to Stata graphics. We have selected literature similar in name and meaning in the hope of providing readers with more options to find new, interesting, not yet read works.
Discussion, reviews of the book A visual guide to Stata graphics and just readers' own opinions. Leave your comments, write what you think about the work, its meaning or the main characters. Specify what exactly you liked and what you didn't like, and why you think so.