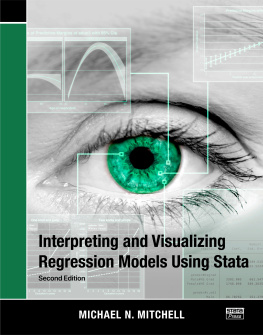
Interpreting and Visualizing
Regression Models Using Stata
Second Edition
Michael N. Mitchell


A Stata Press Publication
StataCorp LLC
College Station, Texas

Copyright 2012, 2021 by StataCorp LLC
All rights reserved. First edition 2012
Second edition 2021
Published by Stata Press, 4905 Lakeway Drive, College Station, Texas 77845
Typeset in L A T E X 
Printed in the United States of America
Print ISBN-10: 1-59718-321-0
Print ISBN-13: 978-1-59718-321-5
ePub ISBN-10: 1-59718-322-9
ePub ISBN-13: 978-1-59718-322-2
Mobi ISBN-10: 1-59718-323-7
Mobi ISBN-13: 978-1-59718-323-9
Library of Congress Control Number: 2020950108
No part of this book may be reproduced, stored in a retrieval system, or transcribed, in any form or by any meanselectronic, mechanical, photocopy, recording, or otherwisewithout the prior written permission of StataCorp LLC.
Stata,  , Stata Press, Mata,
  , and NetCourse are registered trademarks of StataCorp LLC.
Stata and Stata Press are registered trademarks with the World Intellectual Property Organization of the United Nations.
NetCourseNow is a trademark of StataCorp LLC.
L A T E X  is a trademark of the American Mathematical Society.
Contents
1.1
1.2
1.2.1
1.2.2
1.2.3
1.2.4
1.3
1.4
1.5
1.6
1.7
2.1
2.2
2.2.1
2.2.2
2.3
2.3.1
2.3.2
2.3.3
2.4
2.4.1
2.4.2
2.4.3
2.4.4
2.4.5
2.5
2.5.1
2.5.2
2.6
3.1
3.2
3.2.1
3.2.2
3.3
3.3.1
3.3.2
3.4
3.4.1
3.4.2
3.5
3.6
4.1
4.2
4.3
4.3.1
4.3.2
4.4
4.4.1
4.4.2
4.5
4.5.1
4.5.2
4.6
4.6.1
4.6.2
4.7
4.8
4.9
4.10
4.11
5.1
5.2
5.2.1
5.2.2
5.2.3
5.2.4
5.2.5
5.2.6
5.3
5.3.1
5.3.2
5.4
6.1
6.2
6.3
6.3.1
6.3.2
6.4
7.1
7.2
7.3
7.4
7.5
7.5.1
7.5.2
7.5.3
7.6
7.6.1
7.7
7.7.1
7.7.2
7.8
7.8.1
7.8.2
7.9
7.10
7.11
7.12
7.13
7.14
7.15
8.1
8.2
8.2.1
8.2.2
8.2.3
8.2.4
8.3
8.3.1
8.3.2
8.3.3
8.4
8.4.1
8.4.2
8.4.3
8.4.4
8.4.5
8.5
8.6
8.7
8.8
9.1
9.2
9.2.1
9.2.2
9.2.3
9.3
9.3.1
9.3.2
9.3.3
9.3.4
9.4
9.4.1
9.4.2
9.4.3
9.5
10.1
10.2
10.2.1
10.2.2
10.3
10.3.1
10.3.2
10.4
10.4.1
10.4.2
10.5
11.1
11.2
11.2.1
11.2.2
11.2.3
11.3
11.4
12.1
12.2
12.2.1
12.2.2
12.2.3
12.2.4
12.2.5
12.2.6
12.3
12.3.1
12.3.2
12.3.3
12.3.4
12.3.5
12.3.6
12.3.7
12.4
12.4.1
12.4.2
12.4.3
12.4.4
12.4.5
12.5
13.1
13.2
13.2.1
13.2.2
13.2.3
13.2.4
13.2.5
13.3
13.3.1
13.3.2
13.3.3
13.3.4
13.4
14.1
14.2
14.3
14.4
14.5
14.6
15.1
15.2
15.3
15.4
15.5
15.6
16.1
16.2
16.3
16.4
16.5
16.5.1
16.5.2
16.5.3
16.5.4
16.6
17.1
17.2
17.3
17.4
17.5
17.6
17.7
18.1
18.2
18.2.1
18.2.2
18.2.3
18.3
18.4
18.5
18.6
18.6.1
18.6.2
18.6.3
18.7
A
A.1
A.2
A.3
A.4
B
B.1
B.2
B.3
B.4
B.5
B.6
B.7
C
D
D.1
D.2
D.3
D.4
D.5
E
Tables
5.1
5.2
7.1
12.1
12.2
12.3
12.4
14.1
14.2
Figures
1.1
1.2
1.3
1.4
1.5
1.6
2.1
2.2
2.3
2.4
2.5
2.6
2.7
2.8
2.9
2.10
2.11
3.1
3.2
3.3
3.4
3.5
3.6
3.7
3.8
3.9
3.10
3.11
3.12
3.13
3.14
3.15
3.16
3.17
3.18
3.19
3.20
4.1
4.2
4.3
4.4
4.5
4.6
4.7
4.8
4.9
4.10
4.11
4.12
4.13
4.14
4.15
4.16
4.17
4.18
4.19
4.20
5.1
5.2
5.3
5.4
5.5
5.6
5.7
5.8
5.9
5.10
5.11
5.12
5.13
6.1
6.2
6.3
6.4
6.5
6.6
7.1
7.2
7.3
7.4
7.5
7.6
7.7
7.8
8.1
8.2
8.3
8.4
8.5
8.6
8.7
8.8
8.9
8.10
9.1
9.2
9.3
9.4
9.5
9.6
9.7
9.8
9.9
9.10
9.11
10.1
10.2
10.3
10.4
10.5
10.6
10.7
10.8
10.9
10.10
10.11
10.12
11.1
11.2
11.3
11.4
11.5
11.6
11.7
11.8
11.9
11.10
11.11
11.12
11.13
11.14
12.1
12.2
12.3
12.4
12.5
12.6
12.7
12.8
12.9
13.1
13.2
13.3
13.4
13.5
13.6
14.1
14.2
15.1
15.2
15.3
15.4
15.5
16.1
16.2
16.3
16.4
16.5
17.1
17.2
17.3
18.1
18.2
18.3
18.4
18.5
18.6
18.7
18.8
18.9
18.10
18.11
18.12
18.13
18.14
18.15
18.16
18.17
18.18
19.1
Preface to the Second Edition
It was back in March of 2012 that I penned the preface for the first edition of thisbook. That was over eight years and four Stata versions ago (using Stata 12.1).The techniques illustrated in this book are as relevant today as they were back in2012. Over this time, Stata has grown considerably. A key change that impactsthe interpretation of statistical results (a focus of this book) is that the levels offactor variables are now labeled using value labels (instead of group numbers). Forexample, a two-level version of marital status might be labeled as Married and Unmarried instead of using numeric values such as and . All the output in thisnew edition capitalizes on this feature, emphasizing the interpretation of resultsbased on variables labeled using intuitive value labels. Stata now includes featuresthat allow you to customize output in ways that increase the clarity of the results,aiding interpretation. This new edition includes a new appendix (appendix ) thatillustrates how you can customize the output of estimation commands for maximumclarity.
The margins , contrast , and pwcompare commands also reflect this new output style,defaulting to labeling groups according to their value labels. Results of these commands areeasier to interpret than ever. For instance, a contrast regarding marital status might belabeled as widowed vs. married , making it very clear which groups are being compared.This new edition uses this labeling style and also includes appendices that describe how tocustomize such output. Appendix on the marginsplot command illustrates new graphical features that have beenrecently introduced, including using transparency to more clearly visualize overlappingconfidence intervals.
Among the other new features introduced since the last edition of this book, the mixed and contrast commands now include options for computing estimates for small-sample sizes.Chapter describes these techniques and illustrates how the mixed and contrast commands can use small-sample size methods to analyze a longitudinal dataset with asmall-sample size.

