Michael J. Campbell - Statistics at Square Two
Here you can read online Michael J. Campbell - Statistics at Square Two full text of the book (entire story) in english for free. Download pdf and epub, get meaning, cover and reviews about this ebook. City: Hoboken, year: 2023, publisher: Wiley-Blackwell, genre: Science. Description of the work, (preface) as well as reviews are available. Best literature library LitArk.com created for fans of good reading and offers a wide selection of genres:
Romance novel
Science fiction
Adventure
Detective
Science
History
Home and family
Prose
Art
Politics
Computer
Non-fiction
Religion
Business
Children
Humor
Choose a favorite category and find really read worthwhile books. Enjoy immersion in the world of imagination, feel the emotions of the characters or learn something new for yourself, make an fascinating discovery.
- Book:Statistics at Square Two
- Author:
- Publisher:Wiley-Blackwell
- Genre:
- Year:2023
- City:Hoboken
- Rating:5 / 5
- Favourites:Add to favourites
- Your mark:
Statistics at Square Two: summary, description and annotation
We offer to read an annotation, description, summary or preface (depends on what the author of the book "Statistics at Square Two" wrote himself). If you haven't found the necessary information about the book — write in the comments, we will try to find it.
An easy-to-follow exploration of intermediate statistical techniques used in medical research
In the newly revised third edition of Statistics at Square Two: Understanding Modern Statistical Applications in Medicine, a team of distinguished statisticians delivers an accessible and intuitive discussion of advanced statistical methods for readers and users of scientific medical literature. This will allow readers to engage critically with modern research as the authors explain the correct interpretation of results in the medical literature.
The book includes two brand new chapters covering meta-analysis and time-series analysis as well as new references to the many checklists that have appeared in recent years to enable better reporting of contemporary research. Most examples have been updated as well, and each chapter contains practice exercises and answers. Readers will also find sample code (in R) for many of the analyses, in addition to:
- A thorough introduction to models and data, including the different types of data, statistical models, and computer-intensive methods
- Comprehensive explorations of multiple linear regression, including the interpretation of computer output, diagnostic statistics such as influential points, and many uses of multiple regression
- Practical discussions of multiple logistic regression, survival analysis, Poisson regression and random effects models including their uses, examples in the medical literature, and strategies for interpreting computer output
Perfect for anyone hoping to better understand the statistics presented in contemporary medical research, Statistics at Square Two: Understanding Modern Statistical Applications in Medicine will also benefit postgraduate students studying statistics and medicine.
Michael J. Campbell: author's other books
Who wrote Statistics at Square Two? Find out the surname, the name of the author of the book and a list of all author's works by series.








 is equivalent to:
  . This can be generalised to:
  for arbitrary n so
  n times.
 (A1.1)
 , because:
  .
. can be shown to be equivalent to:
  , because:
  and also:
  .
. can be shown equivalent to 1/x, because:
  .
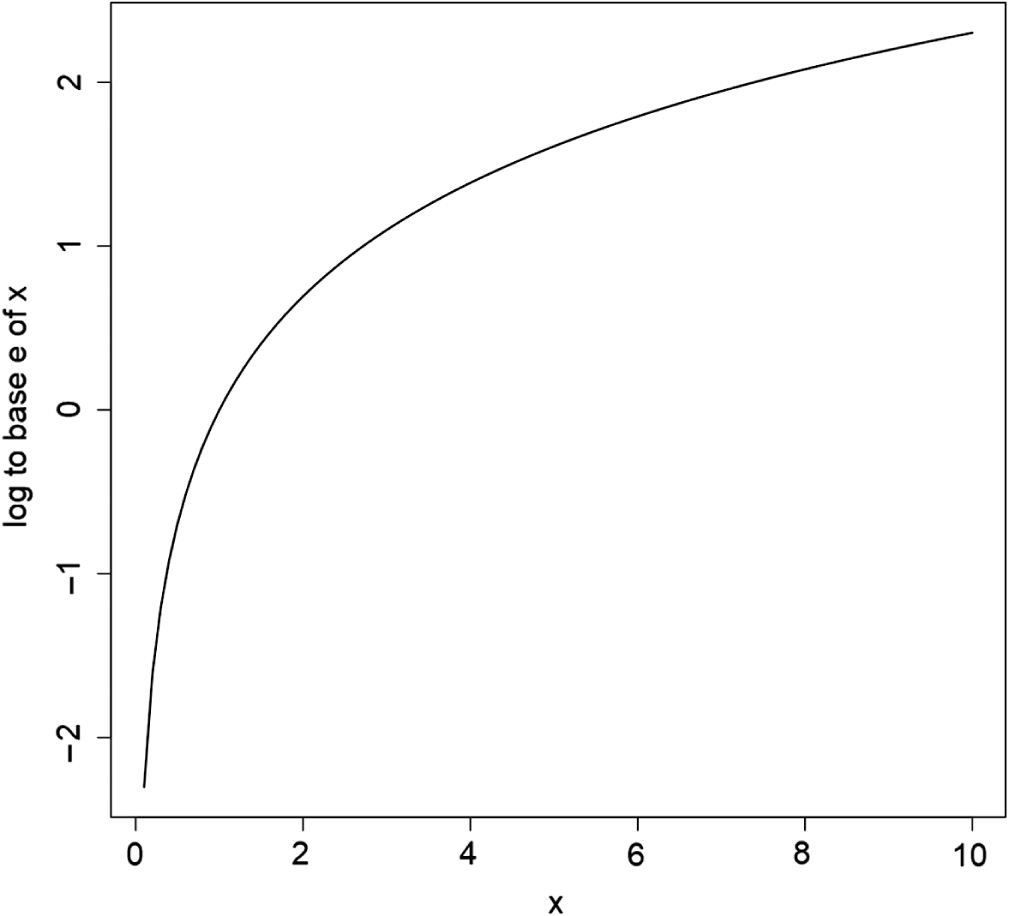
. , then the definition of a logarithm of y to the base x is the power that x has to be raised to get y. This is written:
  or n equals log to the base x of y.
 and
and  . It can be shown from Equation A1.1 that:

 at any point (x, y) is just y, whereas for all other bases the slope is proportional to y but not exactly equal to it. The formula:
  is often written:
  . The logarithms to base e and 10 are often denoted ln and log respectively on calculators, and log and log10 in R. Logs to base e are often called the natural logarithm. In this book all logarithms are natural, that is to base e. We can get from one base to the other by noting that:
  . To find the value of e in R use the fact that:
  , thus:
 .
. .
. ,
,  .
.