This edition first published 2015
2015 John Wiley & Sons, Ltd
Registered office
John Wiley & Sons Ltd, The Atrium, Southern Gate, Chichester, West Sussex, PO19 8SQ, United Kingdom
For details of our global editorial offices, for customer services and for information about how to apply for permission to reuse the copyright material in this book please see our website at www.wiley.com.
The right of the author to be identified as the author of this work has been asserted in accordance with the Copyright, Designs and Patents Act 1988.
All rights reserved. No part of this publication may be reproduced, stored in a retrieval system, or transmitted, in any form or by any means, electronic, mechanical, photocopying, recording or otherwise, except as permitted by the UK Copyright, Designs and Patents Act 1988, without the prior permission of the publisher.
Wiley also publishes its books in a variety of electronic formats. Some content that appears in print may not be available in electronic books.
Designations used by companies to distinguish their products are often claimed as trademarks. All brand names and product names used in this book are trade names, service marks, trademarks or registered trademarks of their respective owners. The publisher is not associated with any product or vendor mentioned in this book.
Limit of Liability/Disclaimer of Warranty: While the publisher and author have used their best efforts in preparing this book, they make no representations or warranties with respect to the accuracy or completeness of the contents of this book and specifically disclaim any implied warranties of merchantability or fitness for a particular purpose. It is sold on the understanding that the publisher is not engaged in rendering professional services and neither the publisher nor the author shall be liable for damages arising herefrom. If professional advice or other expert assistance is required, the services of a competent professional should be sought.
Library of Congress Cataloging-in-Publication Data
Crawley, Michael J.
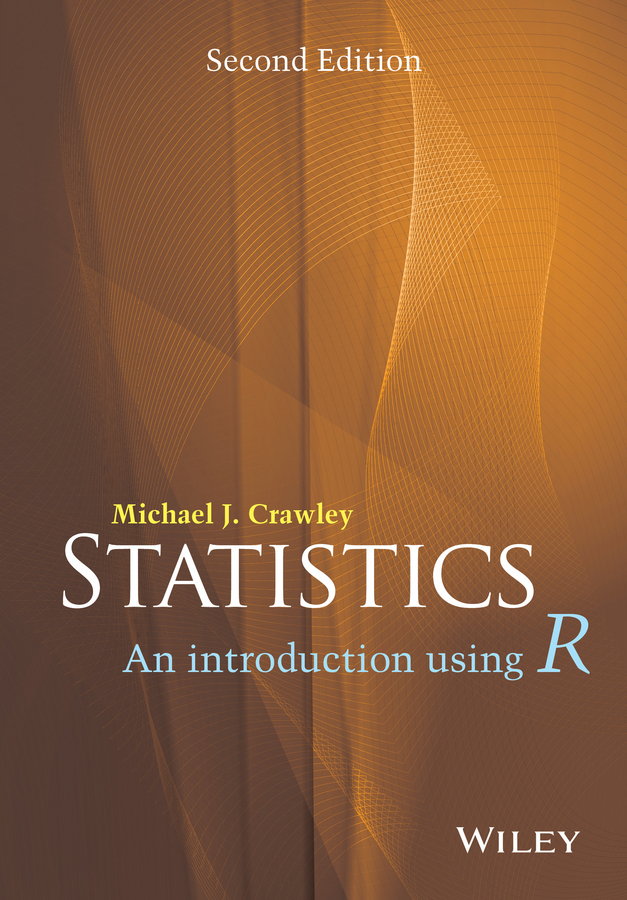
Statistics : an introduction using R / Michael J. Crawley. Second edition.
pages cm
Includes bibliographical references and index.
ISBN 978-1-118-94109-6 (pbk.)
1. Mathematical statisticsTextbooks. 2. R (Computer program language) I. Title.
QA276.12.C73 2015
519.50285'5133dc23
2014024528
A catalogue record for this book is available from the British Library.
ISBN: 9781118941096 (pbk)
Preface
This book is an introduction to the essentials of statistical analysis for students who have little or no background in mathematics or statistics. The audience includes first- and second-year undergraduate students in science, engineering, medicine and economics, along with post-experience and other mature students who want to relearn their statistics, or to switch to the powerful new language of R.
For many students, statistics is the least favourite course of their entire time at university. Part of this is because some students have convinced themselves that they are no good at sums, and consequently have tried to avoid contact with anything remotely quantitative in their choice of subjects. They are dismayed, therefore, when they discover that the statistics course is compulsory. Another part of the problem is that statistics is often taught by people who have absolutely no idea how difficult some of the material is for non-statisticians. As often as not, this leads to a recipe-following approach to analysis, rather than to any attempt to understand the issues involved and how to deal with them.
The approach adopted here involves virtually no statistical theory. Instead, the assumptions of the various statistical models are discussed at length, and the practice of exposing statistical models to rigorous criticism is encouraged. A philosophy of model simplification is developed in which the emphasis is placed on estimating effect sizes from data, and establishing confidence intervals for these estimates. The role of hypothesis testing at an arbitrary threshold of significance like  is played down. The text starts from absolute basics and assumes absolutely no background in statistics or mathematics.
As to presentation, the idea is that background material would be covered in a series of 1-hour lectures, then this book could be used as a guide to the practical sessions and for homework, with the students working on their own at the computer. My experience is that the material can be covered in 1030 lectures, depending on the background of the students and the depth of coverage it is hoped to achieve. The practical work is designed to be covered in 1015 sessions of about 1 hours each, again depending on the ambition and depth of the coverage, and on the amount of one-to-one help available to the students as they work at their computers.
The R language of statistical computing has an interesting history. It evolved from the S language, which was first developed at the AT&T Bell Laboratories by Rick Becker, John Chambers and Allan Wilks. Their idea was to provide a software tool for professional statisticians who wanted to combine state-of-the-art graphics with powerful model-fitting capability. S is made up of three components. First and foremost, it is a powerful tool for statistical modelling. It enables you to specify and fit statistical models to your data, assess the goodness of fit and display the estimates, standard errors and predicted values derived from the model. It provides you with the means to define and manipulate your data, but the way you go about the job of modelling is not predetermined, and the user is left with maximum control over the model-fitting process. Second, S can be used for data exploration, in tabulating and sorting data, in drawing scatter plots to look for trends in your data, or to check visually for the presence of outliers. Third, it can be used as a sophisticated calculator to evaluate complex arithmetic expressions, and a very flexible and general object-orientated programming language to perform more extensive data manipulation. One of its great strengths is in the way in which it deals with vectors (lists of numbers). These may be combined in general expressions, involving arithmetic, relational and transformational operators such as sums, greater-than tests, logarithms or probability integrals. The ability to combine frequently-used sequences of commands into functions makes S a powerful programming language, ideally suited for tailoring one's specific statistical requirements. S is especially useful in handling difficult or unusual data sets, because its flexibility enables it to cope with such problems as unequal replication, missing values, non-orthogonal designs, and so on. Furthermore, the open-ended style of S is particularly appropriate for following through original ideas and developing new concepts. One of the great advantages of learning S is that the simple concepts that underlie it provide a unified framework for learning about statistical ideas in general. By viewing particular models in a general context, S highlights the fundamental similarities between statistical techniques and helps play down their superficial differences. As a commercial product S evolved into S-PLUS, but the problem was that S-PLUS was very expensive. In particular, it was much too expensive to be licensed for use in universities for teaching large numbers of students. In response to this, two New Zealand-based statisticians, Ross Ihaka and Robert Gentleman from the University of Auckland, decided to write a stripped-down version of S for teaching purposes. The letter R comes before S, so what would be more natural than for two authors whose first initial was R to christen their creation R. The code for R was released in 1995 under a General Public License, and the core team was rapidly expanded to 15 members (they are listed on the website, below). Version 1.0.0 was released on 29 February 2000. This book is written using version 3.0.1, but all the code will run under earlier releases.
Next page


 is played down. The text starts from absolute basics and assumes absolutely no background in statistics or mathematics.