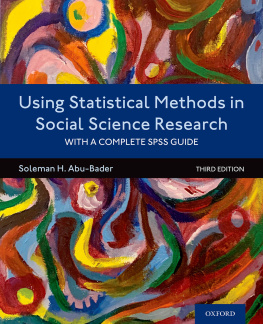
Using Statistical Methods in Social Science Research

Oxford University Press is a department of the University of Oxford. It furthers the Universitys objective of excellence in research, scholarship, and education by publishing worldwide. Oxford is a registered trade mark of Oxford University Press in the UK and certain other countries.
Published in the United States of America by Oxford University Press
198 Madison Avenue, New York, NY 10016, United States of America.
Oxford University Press 2021, 2011
All rights reserved. No part of this publication may be reproduced, stored in a retrieval system, or transmitted, in any form or by any means, without the prior permission in writing of Oxford University Press, or as expressly permitted by law, by license, or under terms agreed with the appropriate reproduction rights organization. Inquiries concerning reproduction outside the scope of the above should be sent to the Rights Department, Oxford University Press, at the address above.
You must not circulate this work in any other form
and you must impose this same condition on any acquirer.
Cataloging-in-Publication Data is on file with the Library of Congress
ISBN 9780197522431
ISBN 9780197522486
9 8 7 6 5 4 3 2 1
Printed by LSC Communications, United States of America
To Buthaina, Nagham, Layanne, and Samer, my great family, friends, and support system, with love and appreciation.
Table of Contents
It is with great happiness and satisfaction that I was able to complete this newly edited version of Using Statistical Methods in Social Science Research: With a Complete SPSS Guide. Since the release of the second edition in 2011, many students and faculty, including myself, and researchers around the country and abroad have used it either as a required textbook or a recommended reference for their statistic courses and/or for their research projects. Over the years, I have received a lot of feedback and comments about the book, its organization, details, and how simple it is to follow, especially its step-by-step SPSS guides. At the same time, many have also recommended the addition of new topics, data evaluation methods, examples, and tables. Moreover, since 2011, IBM has released many new SPSS versions that necessitate the need to update all SPSS screens and output, which originally were generated using SPSS Version 18.
Taking all of these factors into consideration, and to provide students, faculty, and researchers with the most-up-to date SPSS version, all chapters were carefully reviewed and updated. In particular, the following summarizes all revisions, additions, and changes made in this edition:
Updated all SPSS Version 18.0 screens and output with the latest SPSS Version 26.0.
Updated all practical examples.
Updated all practical exercises and added new hand calculations, multiple-choice, truefalse, and fill-in-the blank exercises.
Added key terms at the end of each chapter.
Replaced most of the tables and graphs (histograms, Q-Q plots, scatterplots, etc.).
).
).
).
).
).
).
).
).
).
).
).
).
).
).
).
).
).
).
(Hand Calculations).
).
).
).
Updated the references list.
In addition to these revisions and changes, I included a new detailed appendix () containing nine critical values tables used to determine the level of significance for each test statistic. These hand calculations and critical values are of great importance for graduate students who may seek to teach undergraduate statistics courses, which require basic knowledge of mathematical concepts and statistical equations.
I hope that by releasing this new edition, I met your expectations of a providing you with a user-friendly edition that will greatly benefit you in developing your hypotheses and evaluating, organizing, analyzing, and reporting your data in ways that are easy to understand.
Data Files
This book uses the Statistical Package for Social Sciences (SPSS) Version 26.0 as the main computer software to organize, summarize, and analyze the data. This program was chosen because it is one of the most popular computer software programs and is available in most university computer labs. Users of other statistical software, such as Excel, R Stat, SAS, or Stata, or users of handheld calculators still can greatly benefit from this book because it provides a detailed discussion of the process of organizing and summarizing data, selecting the appropriate test statistic, understanding the test and its underlying assumptions, and writing and presenting the results in summary tables and graphs. These same descriptive and inferential statistics can be computed by any other computer software or hand calculators ().
Finally, practical examples and exercises that are discussed in this book rely on eight SPSS data files. These files can be obtained from Learning Link at Oxford University Press: www.oup.com/he/abu-bader3e. describes these files in detail.
Acknowledgments
Many thanks to my Data Analysis and Quantitative Methods students at Howard University for their feedback and comments, especially the 20182020 classes. Thank you also to my graduate assistants, Latoya Hogg and Imani Smith, for their help, suggestions, and edits.
A special thank you and my sincere appreciation goes to my former research assistant and current colleague, Dr. Tiffanie Jones, who took her time to review each chapter and provided very helpful constructive comments and corrections. For that I am grateful.
I also would like to extend special thanks to Dr. Thomas OHare of Boston College and the Oxford University Press editors and staff, Sarah Butcher, Stefano Imbert, Alyssa Palazzo, and Melissa Yanuzzi, whose suggestions enhanced this new edition.
Chapter 1
Chapter 3
Chapter 4
Chapter 5
Chapter 6
Chapter 7
Chapter 8
Chapter 9
Chapter 10
Chapter 12
Chapter 1
Chapter 2
Chapter 3
Chapter 4
Chapter 5
Chapter 6
Chapter 7
Chapter 8
Chapter 9
Chapter 10
Chapter 11
Chapter 12
Appendix A
Appendix B
Appendix C
Chapter 2
Chapter 3
Chapter 4
Chapter 5
Chapter 6
Chapter 7
Chapter 8
Chapter 9
Chapter 10
Chapter 11
Chapter 12
In this chapter I introduce and define basic mathematical and research methodological terms used throughout this book. These include the following:
Basic mathematical concepts
Variables and constants
Quantitative and qualitative variables
Types of variables

