Victor Lee - Graph-Powered Analytics and Machine Learning with TigerGraph(11th Early ReleaseB)
Here you can read online Victor Lee - Graph-Powered Analytics and Machine Learning with TigerGraph(11th Early ReleaseB) full text of the book (entire story) in english for free. Download pdf and epub, get meaning, cover and reviews about this ebook. year: 2023, publisher: OReilly Media, Inc., genre: Computer. Description of the work, (preface) as well as reviews are available. Best literature library LitArk.com created for fans of good reading and offers a wide selection of genres:
Romance novel
Science fiction
Adventure
Detective
Science
History
Home and family
Prose
Art
Politics
Computer
Non-fiction
Religion
Business
Children
Humor
Choose a favorite category and find really read worthwhile books. Enjoy immersion in the world of imagination, feel the emotions of the characters or learn something new for yourself, make an fascinating discovery.
- Book:Graph-Powered Analytics and Machine Learning with TigerGraph(11th Early ReleaseB)
- Author:
- Publisher:OReilly Media, Inc.
- Genre:
- Year:2023
- Rating:4 / 5
- Favourites:Add to favourites
- Your mark:
Graph-Powered Analytics and Machine Learning with TigerGraph(11th Early ReleaseB): summary, description and annotation
We offer to read an annotation, description, summary or preface (depends on what the author of the book "Graph-Powered Analytics and Machine Learning with TigerGraph(11th Early ReleaseB)" wrote himself). If you haven't found the necessary information about the book — write in the comments, we will try to find it.
Victor Lee: author's other books
Who wrote Graph-Powered Analytics and Machine Learning with TigerGraph(11th Early ReleaseB)? Find out the surname, the name of the author of the book and a list of all author's works by series.

![Eifrem Emil - Graph Databases: [new opportunities for connected data]](/uploads/posts/book/173054/thumbs/eifrem-emil-graph-databases-new-opportunities.jpg)


Graph-Powered Analytics and Machine Learning with TigerGraph(11th Early ReleaseB) — read online for free the complete book (whole text) full work
Below is the text of the book, divided by pages. System saving the place of the last page read, allows you to conveniently read the book "Graph-Powered Analytics and Machine Learning with TigerGraph(11th Early ReleaseB)" online for free, without having to search again every time where you left off. Put a bookmark, and you can go to the page where you finished reading at any time.
Font size:
Interval:
Bookmark:
by Victor Lee , Phuc Kien Nguyen , and Alexander Thomas
Copyright 2023 OReilly Media. All rights reserved.
Printed in the United States of America.
Published by OReilly Media, Inc. , 1005 Gravenstein Highway North, Sebastopol, CA 95472.
OReilly books may be purchased for educational, business, or sales promotional use. Online editions are also available for most titles (http://oreilly.com). For more information, contact our corporate/institutional sales department: 800-998-9938 or corporate@oreilly.com .
- Acquisitions Editor: Nicole Butterfield
- Development Editor: Gary OBrien
- Production Editor: Jonathon Owen
- Interior Designer: David Futato
- Cover Designer: Karen Montgomery
- Illustrator: Kate Dullea
- 2021-04-12: First Release
- 2021-09-29: Second Release
- 2022-02-22: Third Release
- 2022-04-21: Fourth Release
- 2022-05-19: Fifth Release
- 2022-08-24: Sixth Release
- 2022-10-06: Seventh Release
- 2022-11-22: Eighth Release
- 2023-01-06: Ninth Release
- 2023-02-07: Tenth Release
- 2023-04-03: Eleventh Release
See http://oreilly.com/catalog/errata.csp?isbn=9781098106652 for release details.
The OReilly logo is a registered trademark of OReilly Media, Inc. Graph-Powered Analytics and Machine Learning with TigerGraph, the cover image, and related trade dress are trademarks of OReilly Media, Inc.
The views expressed in this work are those of the authors, and do not represent the publishers views. While the publisher and the authors have used good faith efforts to ensure that the information and instructions contained in this work are accurate, the publisher and the authors disclaim all responsibility for errors or omissions, including without limitation responsibility for damages resulting from the use of or reliance on this work. Use of the information and instructions contained in this work is at your own risk. If any code samples or other technology this work contains or describes is subject to open source licenses or the intellectual property rights of others, it is your responsibility to ensure that your use thereof complies with such licenses and/or rights.
This work is part of a collaboration between OReilly and TigerGraph. See our statement of editorial independence .
978-1-098-10658-4
[LSI]
With Early Release ebooks, you get books in their earliest formthe authors raw and unedited content as they writeso you can take advantage of these technologies long before the official release of these titles.
This will be the 1st chapter of the final book.
If you have comments about how we might improve the content and/or examples in this book, or if you notice missing material within this chapter, please reach out to the editor at .
In an extreme view, the world can be seen as only connections, nothing else. We think of a dictionary as the repository of meaning, but it defines words only in terms of other words. I liked the idea that a piece of information is really defined only by what its related to, and how its related. There really is little else to meaning. The structure is everything.
Tim Berners-Lee, in Weaving TheWeb :The Original Design and Ultimate Destiny of the World Wide Web (1999), p. 14
The twentieth century demonstrated how much we could achieve with spreadsheets and relational databases. Tabular data ruled. The twenty-first century has already shown us that that isnt enough. Tables flatten our perspective, showing connections in only two dimensions. In the real world, things are related to and connected to a myriad of other things, and those relationships shape what is and what will happen. To gain full understanding, we need to model these connections.
Personal computers were introduced in the 1970s, but they didnt take off until they found their first killer apps: financial spreadsheets. VisiCalc on the Apple II and then Lotus 1-2-3 on the IBM PC automated the laborious and error-prone calculations that bookkeepers had been doing by hand ever since the invention of writing and arithmetic: adding up rows and columns of figures, and then perhaps performing even more complex statistical calculations.
In 1970, E.F. Codd published his seminal paper on the relational database model. In these early days of databases, a few models were bouncing around, including the network database model. Codds relational model was built on something that everyone could identify with and was easy to program: the table.
Moreover, matrix algebra and many statistical methods are also ready-made to work with tables. Both physicists and business analysts used matrices to define and find the optimal solutions to everything from nuclear reactor design to supply chain management. Tables lend themselves to parallel processing; just partition the workload vertically or horizontally. Spreadsheets, relational databases, and matrix algebra: the tabular approach seemed to be the solution to everything.
Then the World Wide Web happened and everything changed.
The web is more than the internet. The internet began in the early 1970s as a data connection network between selected US research institutions. The World Wide Web, invented by CERN researcher Tim Berners-Lee in 1989, is a set of technologies running on top of the internet that make it much easier to publish, access, and connect data in a format easy for humans to consume and interact with. Browsers, hyperlinks, and web addresses are also hallmarks of the web. At the same time that the web was being developed, governments were loosening their controls on the internet and allowing private companies to expand it. We now have billions of interconnected web pages, connecting people, multimedia, facts, and opinions, at a truly global scale. Having data isnt enough. How the data is structured matters.
As the word web started to take on new connotations, so did the word graph. For most people, graph was synonymous with a line chart that could show something such as a stocks price over time. Mathematicians had another meaning for the word, however, and as networks and connections started to matter to the business world, the mathematical meaning started to come to the fore.
A graph is an abstract data structure consisting of vertices (or nodes) and connections between vertices called edges. Thats it. A graph is the idea of a network, constructed from these two types of elements. This abstraction allows us to study networks (or graphs) in general, to discover properties and to devise algorithms to solve general tasks. Graph theory and graph analytics provided organizations with the tools they needed to leverage the sudden abundance of connected data.
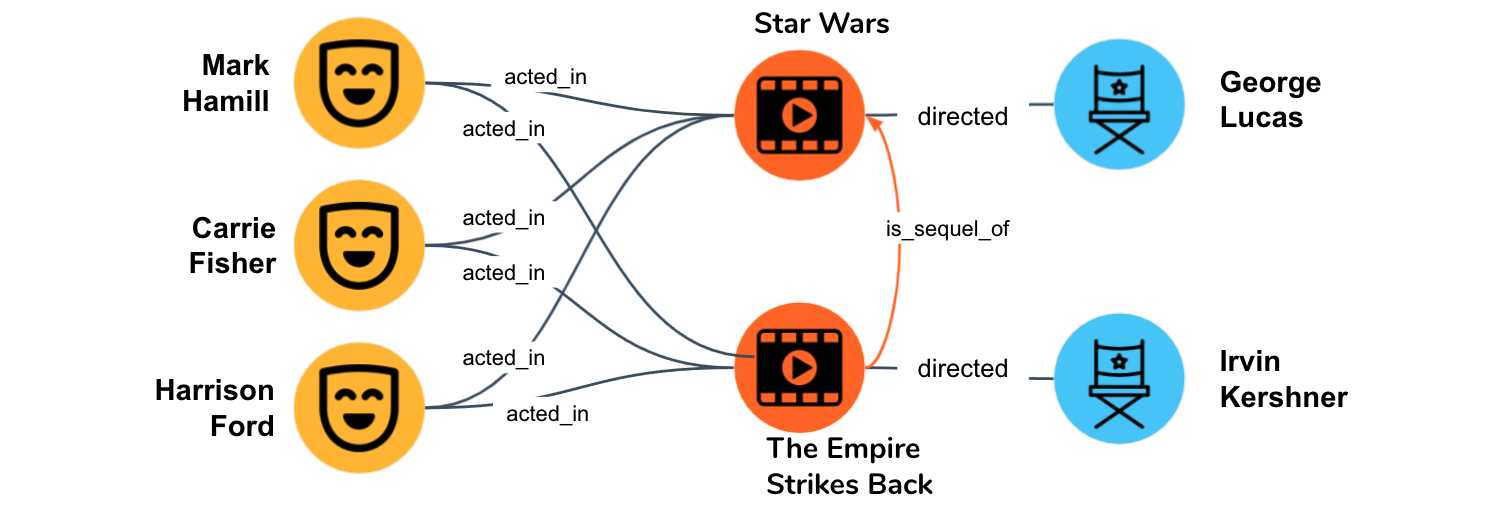
The web showed us that sometimes we accomplish more by having varied data that is linked together, rather than to try to merge it all into a few rigid tables. It also showed us that connections themselves are a form of information. We have a limitless number of types of relationships: parent child, purchaser product, friend friend, and so on. As Berners-Lee observed, we get meaning from connections. When we know someone is a parent, we can infer that they have had certain life experiences and have certain concerns. We can also guess at how the parent and child will interact relative to one another.
Font size:
Interval:
Bookmark:
Similar books «Graph-Powered Analytics and Machine Learning with TigerGraph(11th Early ReleaseB)»
Look at similar books to Graph-Powered Analytics and Machine Learning with TigerGraph(11th Early ReleaseB). We have selected literature similar in name and meaning in the hope of providing readers with more options to find new, interesting, not yet read works.
Discussion, reviews of the book Graph-Powered Analytics and Machine Learning with TigerGraph(11th Early ReleaseB) and just readers' own opinions. Leave your comments, write what you think about the work, its meaning or the main characters. Specify what exactly you liked and what you didn't like, and why you think so.