Victor Lee Ph.D - Graph-Powered Analytics and Machine Learning with TigerGraph: Driving Business Outcomes with Connected Data
Here you can read online Victor Lee Ph.D - Graph-Powered Analytics and Machine Learning with TigerGraph: Driving Business Outcomes with Connected Data full text of the book (entire story) in english for free. Download pdf and epub, get meaning, cover and reviews about this ebook. year: 2024, publisher: OReilly Media, genre: Home and family. Description of the work, (preface) as well as reviews are available. Best literature library LitArk.com created for fans of good reading and offers a wide selection of genres:
Romance novel
Science fiction
Adventure
Detective
Science
History
Home and family
Prose
Art
Politics
Computer
Non-fiction
Religion
Business
Children
Humor
Choose a favorite category and find really read worthwhile books. Enjoy immersion in the world of imagination, feel the emotions of the characters or learn something new for yourself, make an fascinating discovery.

- Book:Graph-Powered Analytics and Machine Learning with TigerGraph: Driving Business Outcomes with Connected Data
- Author:
- Publisher:OReilly Media
- Genre:
- Year:2024
- Rating:3 / 5
- Favourites:Add to favourites
- Your mark:
Graph-Powered Analytics and Machine Learning with TigerGraph: Driving Business Outcomes with Connected Data: summary, description and annotation
We offer to read an annotation, description, summary or preface (depends on what the author of the book "Graph-Powered Analytics and Machine Learning with TigerGraph: Driving Business Outcomes with Connected Data" wrote himself). If you haven't found the necessary information about the book — write in the comments, we will try to find it.
With the rapid rise of graph databases, organizations are now implementing advanced analytics and machine learning solutions to help drive business outcomes. This practical guide shows data scientists, data engineers, architects, and business analysts how to get started with a graph database using TigerGraph, one of the leading graph database models available.
Youll explore a three-stage approach to deriving value from connected data: connect, analyze, and learn. Victor Lee, Xinyu Chan, and Gaurav Deshpande from TigerGraph present real use cases covering several contemporary business needs. By diving into hands-on exercises using TigerGraph Cloud, youll quickly become proficient at designing and managing advanced analytics and machine learning solutions for your organization.
- Use graph thinking to connect, analyze, and learn from data for advanced analytics and machine learning
- Learn how graph analytics and machine learning can deliver key business insights and outcomes
- Use five core categories of graph algorithms to drive advanced analytics and machine learning
- Deliver a real-time 360-degree view of core business entities, including customer, product, service, supplier, and citizen
- Discover insights from connected data through machine learning and advanced analytics
Victor Lee Ph.D: author's other books
Who wrote Graph-Powered Analytics and Machine Learning with TigerGraph: Driving Business Outcomes with Connected Data? Find out the surname, the name of the author of the book and a list of all author's works by series.


![Eifrem Emil - Graph Databases: [new opportunities for connected data]](/uploads/posts/book/173054/thumbs/eifrem-emil-graph-databases-new-opportunities.jpg)


Graph-Powered Analytics and Machine Learning with TigerGraph: Driving Business Outcomes with Connected Data — read online for free the complete book (whole text) full work
Below is the text of the book, divided by pages. System saving the place of the last page read, allows you to conveniently read the book "Graph-Powered Analytics and Machine Learning with TigerGraph: Driving Business Outcomes with Connected Data" online for free, without having to search again every time where you left off. Put a bookmark, and you can go to the page where you finished reading at any time.
Font size:
Interval:
Bookmark:
by Victor Lee , Phuc Kien Nguyen , and Xinyu Chang
Copyright 2022 OReilly Media. All rights reserved.
Printed in the United States of America.
Published by OReilly Media, Inc. , 1005 Gravenstein Highway North, Sebastopol, CA 95472.
OReilly books may be purchased for educational, business, or sales promotional use. Online editions are also available for most titles (http://oreilly.com). For more information, contact our corporate/institutional sales department: 800-998-9938 or corporate@oreilly.com .
- Acquisitions Editor: Nicole Butterfield
- Development Editor: Gary OBrien
- Production Editor: Jonathon Owen
- Interior Designer: David Futato
- Cover Designer: Karen Montgomery
- Illustrator: Kate Dullea
- 2021-04-12: First Release
- 2021-09-29: Second Release
- 2022-02-22: Third Release
- 2022-04-21: Fourth Release
- 2022-05-19: Fifth Release
- 2022-08-24: Sixth Release
- 2022-10-06: Seventh Release
See http://oreilly.com/catalog/errata.csp?isbn=9781098106652 for release details.
The OReilly logo is a registered trademark of OReilly Media, Inc. Graph-Powered Analytics and Machine Learning with TigerGraph, the cover image, and related trade dress are trademarks of OReilly Media, Inc.
The views expressed in this work are those of the authors, and do not represent the publishers views. While the publisher and the authors have used good faith efforts to ensure that the information and instructions contained in this work are accurate, the publisher and the authors disclaim all responsibility for errors or omissions, including without limitation responsibility for damages resulting from the use of or reliance on this work. Use of the information and instructions contained in this work is at your own risk. If any code samples or other technology this work contains or describes is subject to open source licenses or the intellectual property rights of others, it is your responsibility to ensure that your use thereof complies with such licenses and/or rights.
This work is part of a collaboration between OReilly and TigerGraph. See our statement of editorial independence .
978-1-098-10658-4
[LSI]
With Early Release ebooks, you get books in their earliest formthe authors raw and unedited content as they writeso you can take advantage of these technologies long before the official release of these titles.
This will be the 2nd chapter of the final book.
If you have comments about how we might improve the content and/or examples in this book, or if you notice missing material within this chapter, please reach out to the editor at gobrien@oreilly.com.
In Chapter 1, we showed the potential of graph analytics and machine learning applied to human and business endeavors, and we proposed to present the details in three stages: the power of connected data, the power of graph analytics, and the power of graph machine learning. In this chapter, we will take a deep dive into the first stage: the power of connected data.
Before we delve into the power of connected data, we need to lay some groundwork. We start by introducing the concepts and nomenclature of the graph data model. If you are already familiar with graphs, you may want to skim this section to check that were on the same page with regard to terminology. Besides graphs themselves, well cover the important concepts of a graph schema and traversing a graph. Traversal is how we search for data and connections in a graph.
And along the way we talk about the differences between graph and relational databases and how we can ask questions and solve problems with graph analytics that would not be feasible in a relational database.
From that foundational understanding of what is a graph, we move on to present examples of the power of a graph by illustrating six ways that graph data provides you with more insight and more analytical capability than tabular data.
After completing this chapter, you should be able to:
Use the standard terminology for describing graphs
Know the difference between a graph schema and a graph instance
Create a basic graph model or schema from scratch or from a relational database model
Apply the traversal metaphor for searching and exploring graph data
Understand six ways that graph data empowers your knowledge and analytics
State the entity resolution problem and show how graphs resolve this problem
In Chapter 1, we introduced you to the basic idea of a graph. In this section, we are going to go deeper. First we will establish the terminology that we will be using for the rest of this book. Then we will talk more about the idea of a graph schema, which is the key to having a plan and awareness of your datas structure.
Suppose youre organizing data about movies, actors, and directors. Maybe you work for Netflix or one of the other streaming services, or maybe youre just a fan.
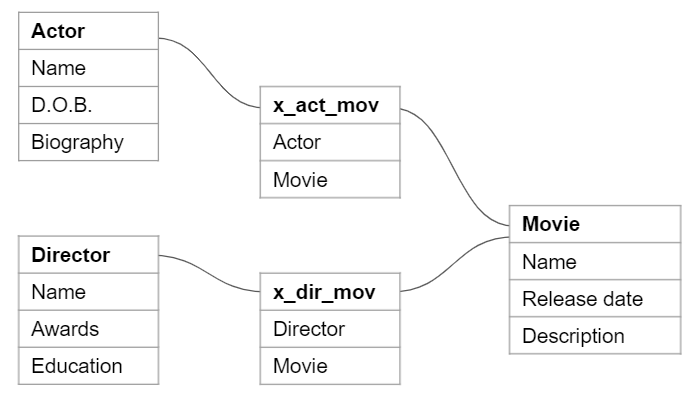
Lets start with one movie, Star Wars: A New Hope, its three main actors and its director. If you were building this in a relational database, you could record this information in a single table, but the table would grow quickly and rapidly become unwieldy. How would we even record details about a movie, the fact that 50 actors appeared in it, and the details of each of those actors careers, all in one table?
Best practice for the design of relational databases would suggest putting actors, movies and directors each into a separate table, but that would mean also adding in cross-reference tables to handle the many-to-many relationships between actors and movies and between movies and directors.
So in total youd need five tables just to represent this example in a relational database, as in .
Separating different types of things into different tables is the right answer for organizing the data, but to see how one record relates to another we have to rejoin the data. A query asking which actors worked with which directors would involve building a temporary table in memory called a join table that includes all possible combinations of rows across all the tables youve called which satisfy the conditions of the query. Join tables are expensive in terms of memory and processor time.
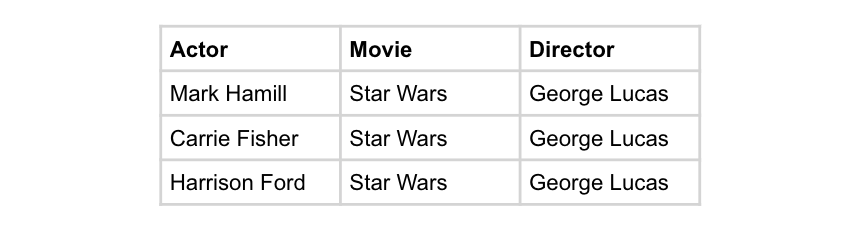
As we can see from , there is a lot of redundant data in this table join. For very large or complex databases, you would want to think of ways to structure the data and your queries to optimize the join tables.
Font size:
Interval:
Bookmark:
Similar books «Graph-Powered Analytics and Machine Learning with TigerGraph: Driving Business Outcomes with Connected Data»
Look at similar books to Graph-Powered Analytics and Machine Learning with TigerGraph: Driving Business Outcomes with Connected Data. We have selected literature similar in name and meaning in the hope of providing readers with more options to find new, interesting, not yet read works.
Discussion, reviews of the book Graph-Powered Analytics and Machine Learning with TigerGraph: Driving Business Outcomes with Connected Data and just readers' own opinions. Leave your comments, write what you think about the work, its meaning or the main characters. Specify what exactly you liked and what you didn't like, and why you think so.