Penguin supports copyright. Copyright fuels creativity, encourages diverse voices, promotes free speech, and creates a vibrant culture. Thank you for buying an authorized edition of this book and for complying with copyright laws by not reproducing, scanning, or distributing any part of it in any form without permission. You are supporting writers and allowing Penguin to continue to publish books for every reader.
PERIGEE is a registered trademark of Penguin Group (USA) LLC.
The P design is a trademark belonging to Penguin Group (USA) LLC.
An application to catalog this book has been submitted to the Library of Congress.
While the author has made every effort to provide accurate telephone numbers, Internet addresses, and other contact information at the time of publication, neither the publisher nor the author assumes any responsibility for errors, or for changes that occur after publication. Further, the publisher does not have any control over and does not assume any responsibility for author or third-party websites or their content.
Most Perigee books are available at special quantity discounts for bulk purchases for sales promotions, premiums, fund-raising, or educational use. Special books, or book excerpts, can also be created to fit specific needs. For details, write: Special.Markets@us.penguingroup.com.
To all those who have joined in the fun at Correlated.org.
INTRODUCTION
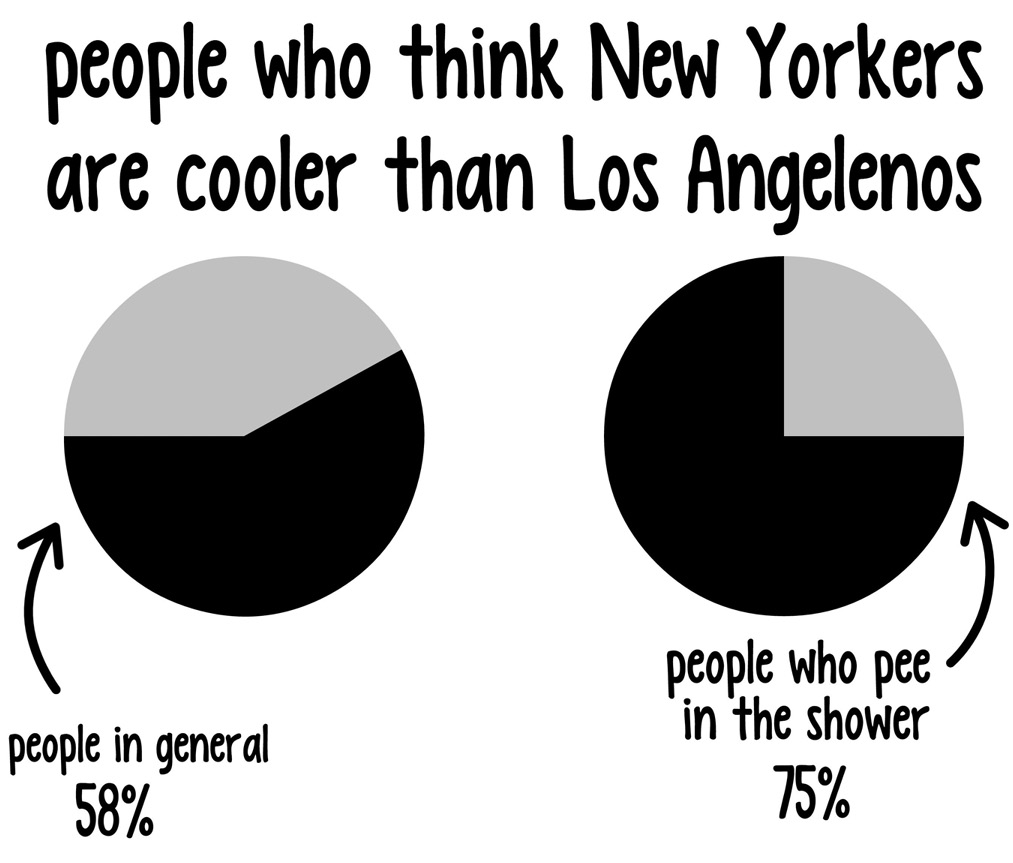
If youve ever wondered whether iPod owners are more likely to stir their drinks counterclockwise, whether nonfiction lovers are more likely to have a positive opinion about France, or whether tea drinkers are more likely to prefer mechanical pencils, then this is the book for you!
The data that underpin the statistics youll find in this book come from Correlated.org, a website devoted to uncovering surprising correlations between seemingly unrelated things.
Each day, a new poll question is posted on the site, and at the end of the day, the poll responses are tallied up and compared with the results of every previous poll to find the two responses with the strongest correlation.
For this book, Ive taken Correlated.orgs large data set1,089,173 poll responses from 36,305 respondentsand generated all-new statistics in which the results of each poll were compared not only with previous polls but with the entirety of the available data. For the 182 topics chosen for inclusion in the book, the median sample size was 2,290 and the mean sample size was 2,222.
Although the statistics in this book are all based on real data, the methodology by which the correlations are generated is not intended to stand up to professional scrutiny. (In fact, it would probably make a professional statistician weep.) Rather, the correlations are intended to be amusing and thought provoking, and to illustrate some of the absurdities that result when you ignore tricky concepts such as confounding variables or the multiple-testing problem.
I hope you enjoy the surprising statistics presented here, and I hope youll join the thousands of others who help generate new correlations by contributing to Correlated.org.
TOPICS
80s Music
40% of people have boycotted a company.
But among those who consider music from the 80s to be oldies, 52% have boycotted a company.
---------------
53% of people are Foo Fighters fans.
But among those who consider music from the 80s to be oldies, only 41% are Foo Fighters fans.
---------------
70% of people are adept at using chopsticks.
But among those who consider music from the 80s to be oldies, only 58% are adept at using chopsticks.
DOUBLE PLAY
Youre extremely likely to consider music from the 80s to be oldies if you both:
- always wash your hands after using a public restroom
- prefer Jake Gyllenhaals movies to Maggie Gyllenhaals
NO CORRELATION
People who consider music from the 80s to be oldies are almost exactly as likely as the average person to:
- have been involved in student government
- dislike honey-mustard sauce
- have a nine-to-five type of job
AAA (The Auto Club)
38% of people have had a poison ivy rash.
But among those who belong to AAA, 54% have had a poison ivy rash.
---------------
77% of people say that if a person dislikes them, its generally because they dont know the real me.
But among those who belong to AAA, 89% say that if a person dislikes them, its generally because they dont know the real me.
---------------
29% of people have visited a chiropractor.
But among those who belong to AAA, 40% have visited a chiropractor.
DOUBLE PLAY
Youre extremely likely to belong to AAA if you both:
- prefer a hot breakfast over a cold breakfast
- consider yourself more generous than the average person
NO CORRELATION
People who belong to AAA are almost exactly as likely as the average person to:
- prefer Google Chrome as their browser
- say theyd agree to work a midnight-to-8-a.m. shift for the next 10 years if the pay were $1 million a year
- have never had asthma
Absent-Mindedness
25% of people say they are better at punctuality than punctuation.
But among those who wouldnt describe themselves as absent-minded, 38% say they are better at punctuality than punctuation.
---------------
32% of people say they had a negative first impression of Pope Francis.
But among those who wouldnt describe themselves as absent-minded, 44% had a negative first impression of Pope Francis.
---------------
42% of people regularly eat yogurt.
But among those who wouldnt describe themselves as absent-minded, 52% regularly eat yogurt.
DOUBLE PLAY
Youre extremely likely to say you arent absent-minded if you both:
- arent a coward
- think clowns are fun
NO CORRELATION
People who wouldnt describe themselves as absent-minded are almost exactly as likely as the average person to:
- say the city where they live is more important than the job they do
- keep it a secret if they found out they had only six months to live
- have participated in an eating contest

