• Complain

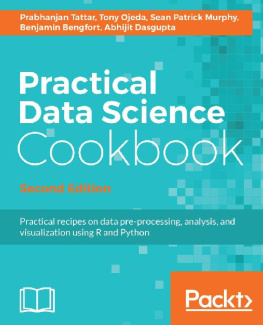
Prabhanjan Tattar - Practical Data Science Cookbook: Data pre-processing, analysis and visualization using R and Python

Here you can read online Prabhanjan Tattar - Practical Data Science Cookbook: Data pre-processing, analysis and visualization using R and Python full text of the book (entire story) in english for free. Download pdf and epub, get meaning, cover and reviews about this ebook. year: 2017, publisher: Packt Publishing, genre: Home and family. Description of the work, (preface) as well as reviews are available. Best literature library LitArk.com created for fans of good reading and offers a wide selection of genres:

Romance novel Science fiction Adventure Detective Science History Home and family Prose Art Politics Computer Non-fiction Religion Business Children Humor

Choose a favorite category and find really read worthwhile books. Enjoy immersion in the world of imagination, feel the emotions of the characters or learn something new for yourself, make an fascinating discovery.

Prabhanjan Tattar Practical Data Science Cookbook: Data pre-processing, analysis and visualization using R and Python

Practical Data Science Cookbook: Data pre-processing, analysis and visualization using R and Python: summary, description and annotation

We offer to read an annotation, description, summary or preface (depends on what the author of the book "Practical Data Science Cookbook: Data pre-processing, analysis and visualization using R and Python" wrote himself). If you haven't found the necessary information about the book — write in the comments, we will try to find it.

Over 85 recipes to help you complete real-world data science projects in R and Python

About This Book
  • Tackle every step in the data science pipeline and use it to acquire, clean, analyze, and visualize your data
  • Get beyond the theory and implement real-world projects in data science using R and Python
  • Easy-to-follow recipes will help you understand and implement the numerical computing concepts
Who This Book Is For

If you are an aspiring data scientist who wants to learn data science and numerical programming concepts through hands-on, real-world project examples, this is the book for you. Whether you are brand new to data science or you are a seasoned expert, you will benefit from learning about the structure of real-world data science projects and the programming examples in R and Python.

What You Will Learn
  • Learn and understand the installation procedure and environment required for R and Python on various platforms
  • Prepare data for analysis by implement various data science concepts such as acquisition, cleaning and munging through R and Python
  • Build a predictive model and an exploratory model
  • Analyze the results of your model and create reports on the acquired data
  • Build various tree-based methods and Build random forest
In Detail

As increasing amounts of data are generated each year, the need to analyze and create value out of it is more important than ever. Companies that know what to do with their data and how to do it well will have a competitive advantage over companies that dont. Because of this, there will be an increasing demand for people that possess both the analytical and technical abilities to extract valuable insights from data and create valuable solutions that put those insights to use.

Starting with the basics, this book covers how to set up your numerical programming environment, introduces you to the data science pipeline, and guides you through several data projects in a step-by-step format. By sequentially working through the steps in each chapter, you will quickly familiarize yourself with the process and learn how to apply it to a variety of situations with examples using the two most popular programming languages for data analysisR and Python.

Style and approach

This step-by-step guide to data science is full of hands-on examples of real-world data science tasks. Each recipe focuses on a particular task involved in the data science pipeline, ranging from readying the dataset to analytics and visualization

Prabhanjan Tattar: author's other books


Who wrote Practical Data Science Cookbook: Data pre-processing, analysis and visualization using R and Python? Find out the surname, the name of the author of the book and a list of all author's works by series.

Practical Data Science Cookbook: Data pre-processing, analysis and visualization using R and Python — read online for free the complete book (whole text) full work

Below is the text of the book, divided by pages. System saving the place of the last page read, allows you to conveniently read the book "Practical Data Science Cookbook: Data pre-processing, analysis and visualization using R and Python" online for free, without having to search again every time where you left off. Put a bookmark, and you can go to the page where you finished reading at any time.

Light

Font size:

Reset

Interval:

Bookmark:

Make
Contents

  • 1: Preparing Your Data Science Environment
    • b'Chapter 1: Preparing Your Data Science Environment'
    • b'Understanding the data science pipeline'
    • b'Installing R on Windows, Mac OS X, and Linux'
    • b'Installing libraries in R and RStudio'
    • b'Installing Python on Linux and Mac OS X'
    • b'Installing Python on Windows'
    • b'Installing the Python data stack on Mac OS X and Linux'
    • b'Installing extra Python packages'
    • b'Installing and using virtualenv'
  • 2: Driving Visual Analysis with Automobile Data with R
    • b'Chapter 2: Driving Visual Analysis with Automobile Data with R'
    • b'Introduction'
    • b'Acquiring automobile fuel efficiency data'
    • b'Preparing R for your first project'
    • b'Importing automobile fuel efficiency data into R'
    • b'Exploring and describing fuel efficiency data'
    • b'Analyzing automobile fuel efficiency over time'
    • b'Investigating the makes and models of automobiles'
  • 3: Creating Application-Oriented Analyses Using Tax Data and Python
    • b'Chapter 3: Creating Application-Oriented Analyses Using Tax Data and Python'
    • b'Introduction'
    • b'Preparing for the analysis of top incomes'
    • b'Importing and exploring the world's top incomes dataset'
    • b'Analyzing and visualizing the top income data of the US'
    • b'Furthering the analysis of the top income groups of the US'
    • b'Reporting with Jinja2'
    • b'Repeating the analysis in R'
  • 4: Modeling Stock Market Data
    • b'Chapter 4: Modeling Stock Market Data'
    • b'Introduction'
    • b'Acquiring stock market data'
    • b'Summarizing the data'
    • b'Cleaning and exploring the data'
    • b'Generating relative valuations'
    • b'Screening stocks and analyzing historical prices'
  • 5: Visually Exploring Employment Data
    • b'Chapter 5: Visually Exploring Employment Data'
    • b'Introduction'
    • b'Preparing for analysis'
    • b'Importing employment data into R'
    • b'Exploring the employment data'
    • b'Obtaining and merging additional data'
    • b'Adding geographical information'
    • b'Extracting state- and county-level wage and employment information'
    • b'Visualizing geographical distributions of pay'
    • b'Exploring where the jobs are, by industry'
    • b'Animating maps for a geospatial time series'
    • b'Benchmarking performance for some common tasks'
  • 6: Driving Visual Analyses with Automobile Data
    • b'Chapter 6: Driving Visual Analyses with Automobile Data'
    • b'Introduction'
    • b'Getting started with IPython'
    • b'Exploring Jupyter Notebook'
    • b'Preparing to analyze automobile fuel efficiencies'
    • b'Exploring and describing fuel efficiency data with Python'
    • b'Analyzing automobile fuel efficiency over time with Python'
    • b'Investigating the makes and models of automobiles with Python'
  • 7: Working with Social Graphs
    • b'Chapter 7: Working with Social Graphs'
    • b'Introduction'
    • b'Preparing to work with social networks in Python'
    • b'Importing networks'
    • b'Exploring subgraphs within a heroic network'
    • b'Finding strong ties'
    • b'Finding key players'
    • b'Exploring the characteristics of entire networks'
    • b'Clustering and community detection in social networks'
    • b'Visualizing graphs'
    • b'Social networks in R'
  • 8: Recommending Movies at Scale (Python)
    • b'Chapter 8: Recommending Movies at Scale (Python)'
    • b'Introduction'
    • b'Modeling preference expressions'
    • b'Understanding the data'
    • b'Ingesting the movie review data'
    • b'Finding the highest-scoring movies'
    • b'Improving the movie-rating system'
    • b'Measuring the distance between users in the preference space'
    • b'Computing the correlation between users'
    • b'Finding the best critic for a user'
    • b'Predicting movie ratings for users'
    • b'Collaboratively filtering item by item'
    • b'Building a non-negative matrix factorization model'
    • b'Loading the entire dataset into the memory'
    • b'Dumping the SVD-based model to the disk'
    • b'Training the SVD-based model'
    • b'Testing the SVD-based model'
  • 9: Harvesting and Geolocating Twitter Data (Python)
    • b'Chapter 9: Harvesting and Geolocating Twitter Data (Python)'
    • b'Introduction'
    • b'Creating a Twitter application'
    • b'Understanding the Twitter API v1.1'
    • b'Determining your Twitter followers and friends'
    • b'Pulling Twitter user profiles'
    • b'Making requests without running afoul of Twitter's rate limits'
    • b'Storing JSON data to disk'
    • b'Setting up MongoDB for storing Twitter data'
    • b'Storing user profiles in MongoDB using PyMongo'
    • b'Exploring the geographic information available in profiles'
    • b'Plotting geospatial data in Python'
  • 10: Forecasting New Zealand Overseas Visitors
    • b'Chapter 10: Forecasting New Zealand Overseas Visitors'
    • b'Introduction'
    • b'The ts object'
    • b'Visualizing time series data'
    • b'Simple linear regression models'
    • b'ACF and PACF'
    • b'ARIMA models'
    • b'Accuracy measurements'
    • b'Fitting seasonal ARIMA models'
  • 11: German Credit Data Analysis
    • b'Chapter 11: German Credit Data Analysis'
    • b'Introduction'
    • b'Simple data transformations'
    • b'Visualizing categorical data'
    • b'Discriminant analysis'
    • b'Dividing the data and the ROC'
    • b'Fitting the logistic regression model'
    • b'Decision trees and rules'
    • b'Decision tree for german data'
Chapter 1. Preparing Your Data Science Environment

A traditional cookbook contains culinary recipes of interest to the authors, and helps readers expand their repertoire of foods to prepare. Many might believe that the end product of a recipe is the dish itself and one can read this book, in much the same way. Every chapter guides the reader through the application of the stages of the data science pipeline to different datasets with various goals. Also, just as in cooking, the final product can simply be the analysis applied to a particular set.

Next page
Light

Font size:

Reset

Interval:

Bookmark:

Make

Similar books «Practical Data Science Cookbook: Data pre-processing, analysis and visualization using R and Python»

Look at similar books to Practical Data Science Cookbook: Data pre-processing, analysis and visualization using R and Python. We have selected literature similar in name and meaning in the hope of providing readers with more options to find new, interesting, not yet read works.


Reviews about «Practical Data Science Cookbook: Data pre-processing, analysis and visualization using R and Python»

Discussion, reviews of the book Practical Data Science Cookbook: Data pre-processing, analysis and visualization using R and Python and just readers' own opinions. Leave your comments, write what you think about the work, its meaning or the main characters. Specify what exactly you liked and what you didn't like, and why you think so.