• Complain

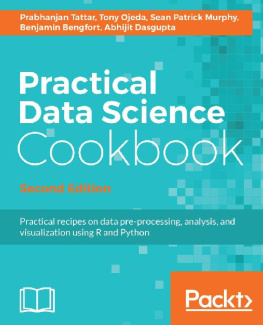
Abhijit Dasgupta - Practical Data Science Cookbook - Second Edition

Here you can read online Abhijit Dasgupta - Practical Data Science Cookbook - Second Edition full text of the book (entire story) in english for free. Download pdf and epub, get meaning, cover and reviews about this ebook. year: 2017, publisher: Packt Publishing, genre: Computer. Description of the work, (preface) as well as reviews are available. Best literature library LitArk.com created for fans of good reading and offers a wide selection of genres:

Romance novel Science fiction Adventure Detective Science History Home and family Prose Art Politics Computer Non-fiction Religion Business Children Humor

Choose a favorite category and find really read worthwhile books. Enjoy immersion in the world of imagination, feel the emotions of the characters or learn something new for yourself, make an fascinating discovery.

Abhijit Dasgupta Practical Data Science Cookbook - Second Edition

Practical Data Science Cookbook - Second Edition: summary, description and annotation

We offer to read an annotation, description, summary or preface (depends on what the author of the book "Practical Data Science Cookbook - Second Edition" wrote himself). If you haven't found the necessary information about the book — write in the comments, we will try to find it.

Over 85 recipes to help you complete real-world data science projects in R and Python

About This Book

  • Tackle every step in the data science pipeline and use it to acquire, clean, analyze, and visualize your data

  • Get beyond the theory and implement real-world projects in data science using R and Python

  • Easy-to-follow recipes will help you understand and implement the numerical computing concepts

  • Who This Book Is For

    If you are an aspiring data scientist who wants to learn data science and numerical programming concepts through hands-on, real-world project examples, this is the book for you. Whether you are brand new to data science or you are a seasoned expert, you will benefit from learning about the structure of real-world data science projects and the programming examples in R and Python.

    What You Will Learn

  • Learn and understand the installation procedure and environment required for R and Python on various platforms

  • Prepare data for analysis by implement various data science concepts such as acquisition, cleaning and munging through R and Python

  • Build a predictive model and an exploratory model

  • Analyze the results of your model and create reports on the acquired data

  • Build various tree-based methods and Build random forest

  • In Detail

    As increasing amounts of data are generated each year, the need to analyze and create value out of it is more important than ever. Companies that know what to do with their data and how to do it well will have a competitive advantage over companies that dont. Because of this, there will be an increasing demand for people that possess both the analytical and technical abilities to extract valuable insights from data and create valuable solutions that put those insights to use.

    Starting with the basics, this book covers how to set up your numerical programming environment, introduces you to the data science pipeline, and guides you through several data projects in a step-by-step format. By sequentially working through the steps in each chapter, you will quickly familiarize yourself with the process and learn how to apply it to a variety of situations with examples using the two most popular programming languages for data analysisR and Python.

    Style and approach

    This step-by-step guide to data science is full of hands-on examples of real-world data science tasks. Each recipe focuses on a particular task involved in the data science pipeline, ranging from readying the dataset to analytics and visualization

    Downloading the example code for this book. You can download the example code files for all Packt books you have purchased from your account at http://www.PacktPub.com. If you purchased this book elsewhere, you can visit http://www.PacktPub.com/support and register to have the code file.

    Abhijit Dasgupta: author's other books


    Who wrote Practical Data Science Cookbook - Second Edition? Find out the surname, the name of the author of the book and a list of all author's works by series.

    Practical Data Science Cookbook - Second Edition — read online for free the complete book (whole text) full work

    Below is the text of the book, divided by pages. System saving the place of the last page read, allows you to conveniently read the book "Practical Data Science Cookbook - Second Edition" online for free, without having to search again every time where you left off. Put a bookmark, and you can go to the page where you finished reading at any time.

    Light

    Font size:

    Reset

    Interval:

    Bookmark:

    Make
    Preface

    Welcome to the second edition of Practical Data Science Cookbook. It was the positive feedback and usefulness that the book has found for its readers that made a second edition possible. When Packt asked me to co-author the second edition, I had a preview of some of its reviews across the web and immediately found the reasons for the popularity of the book and its little weakness. Thus, the current version retains the positives of the acceptance and removes the pain points as much as possible. The two new chapters: , Forecasting New Zealand Overseas Visitors are included to enhance the usefulness of the book.

    We live in the age of data. As increasing amounts are generated each year, the need to analyze and create value from this asset is more important than ever. Companies that know what to do with their data and how to do it well will have a competitive advantage over companies that don't. Due to this, there will be an increasing demand for people who possess both the analytical and technical abilities to extract valuable insights from data and the business acumen to create valuable and pragmatic solutions that put these insights to use. This book provides multiple opportunities to learn how to create value from data through a variety of projects that run the spectrum of types of contemporary data science projects. Each chapter stands on its own, with step-by-step instructions that include screenshots, code snippets, and more detailed explanations where necessary and with a focus on process and practical application. The goal of this book is to introduce the data science pipeline, show you how it applies to a variety of different data science projects, and get you comfortable enough to apply it in future to projects of your own. Along the way, you'll learn different analytical and programming lessons, and the fact that you are working through an actual project while learning will help cement these concepts and facilitate your understanding of them.

    How to do it...

    We will first extract data from ann2014full at the state-level. We need to perform the following steps:

    1. We look at the aggregate state-level data. A peek at agglevel tells us that the code for the level of data that we want is 50. Also, we only want to look at the average annual pay (avg_annual_pay) and the average annual employment level (annual_avg_emplvl), and not the other variables:
    d.state <- filter(ann2014full, agglvl_code==50)
    d.state <- select(d.state, state, avg_annual_pay, annual_avg_emplvl)
    1. We create two new variables, wage and empquantile, which discretizes the pay and employment variables:
    d.state$wage <- cut(d.state$avg_annual_pay,
    quantile(d.state$avg_annual_pay, c(seq(0,.8, by=.2), .9, .95, .99, 1)))
    d.state$empquantile <- cut(d.state$annual_avg_emplvl,
    quantile(d.state$annual_avg_emplvl, c(seq(0,.8,by=.2),.9,.95,.99,1)))

    1. We also want the levels of these discretized variables to be meaningful. So we run the following commands:
    x <- quantile(d.state$avg_annual_pay, c(seq(0,.8,by=.2),.9, .95, .99, 1))
    xx <- paste(round(x/1000),'K',sep='')
    Labs <- paste(xx[-length(xx)],xx[-1],sep='-')
    levels(d.state$wage) <- Labs
    x <- quantile(d.state$annual_avg_emplvl,c(seq(0,.8,by=.2),.9, .95, .99, 1))
    xx <- ifelse(x>1000, paste(round(x/1000),'K',sep=''),round(x))
    Labs <- paste(xx[-length(xx)],xx[-1],sep='-')
    levels(d.state$empquantile) <- Labs

    The 0, 0.2,0.4, 0.6, 0.8, 0.9, 0.95, 0.99, and 1 quantiles of annual average pay is obtained, and it is then obtained per thousand number. The task is then repeated for the annual average employment.

    1. We repeat this process at the county-level. We will find that the appropriate aggregation level code is 70 (agglvl_code==70). Everything else will be the same. Let's try to be a bit smarter this time around. First of all, we will discretize our variables the same way, and then change the labels to match. A function might be a good idea! The following command lines depict this:
    Discretize <- function(x, breaks=NULL){
    if(is.null(breaks)){
    breaks <- quantile(x, c(seq(0,.8,by=.2),.9, .95, .99, 1))
    if (sum(breaks==0)>1) {
    temp <- which(breaks==0, arr.ind=TRUE)
    breaks <- breaks[max(temp):length(breaks)]
    }
    }
    x.discrete <- cut(x, breaks, include.lowest=TRUE)
    breaks.eng <- ifelse(breaks > 1000,
    paste0(round(breaks/1000),'K'),
    round(breaks))
    Labs <- paste(breaks.eng[-length(breaks.eng)], breaks.eng[
    1],

    sep='-')
    levels(x.discrete) <- Labs
    return(x.discrete)
    }
    1. We alluded to the syntactic sugar of dplyr before; now, we see it in action. The dplyr package allows you to string together different operations, piping the results of one operation as input for the next, using the %.% operator. We'll describe the main operations of dplyr in the next recipe. Using some function encapsulation, the following code achieves everything that we spent significantly more lines of code to achieve in steps 1-3:
    d.cty <- filter(ann2012full, agglvl_code==70)%.%
    select(state,county,abb, avg_annual_pay, annual_avg_emplvl)%.%
    mutate(wage=Discretize(avg_annual_pay),
    empquantile=Discretize(annual_avg_emplvl))

    We now have the basic datasets that we need to visualize the geographic patterns in the data.

    Errata

    Although we have taken every care to ensure the accuracy of our content, mistakes do happen. If you find a mistake in one of our books-maybe a mistake in the text or the code-we would be grateful if you could report this to us. By doing so, you can save other readers from frustration and help us improve subsequent versions of this book. If you find any errata, please report them by visiting http://www.packtpub.com/submit-errata , selecting your book, clicking on the Errata Submission Form link, and entering the details of your errata. Once your errata are verified, your submission will be accepted and the errata will be uploaded to our website or added to any list of existing errata under the Errata section of that title. To view the previously submitted errata, go to https://www.packtpub.com/books/content/support and enter the name of the book in the search field. The required information will appear under the Errata section.

    Clustering and community detection in social networks

    Graphs exhibit clustering behavior, and identification of communities is an important task in social networks. A node's clustering coefficient is the number of triadic closures (closed triples) in the node's neighborhood. This is an expression of transitivity. Nodes with higher transitivity exhibit higher subdensity, and if completely closed, form cliques that can be identified as communities. In this recipe, we will look at clustering and community detection in social networks.

    Getting ready

    We will be continuing the efforts of the previous recipes again, so make sure you understand each one.

    Getting ready

    You will need the harvested friends' and/or followers' profiles from Twitter, as directed in the previous recipes.

    Next page
    Light

    Font size:

    Reset

    Interval:

    Bookmark:

    Make

    Similar books «Practical Data Science Cookbook - Second Edition»

    Look at similar books to Practical Data Science Cookbook - Second Edition. We have selected literature similar in name and meaning in the hope of providing readers with more options to find new, interesting, not yet read works.


    Reviews about «Practical Data Science Cookbook - Second Edition»

    Discussion, reviews of the book Practical Data Science Cookbook - Second Edition and just readers' own opinions. Leave your comments, write what you think about the work, its meaning or the main characters. Specify what exactly you liked and what you didn't like, and why you think so.