• Complain

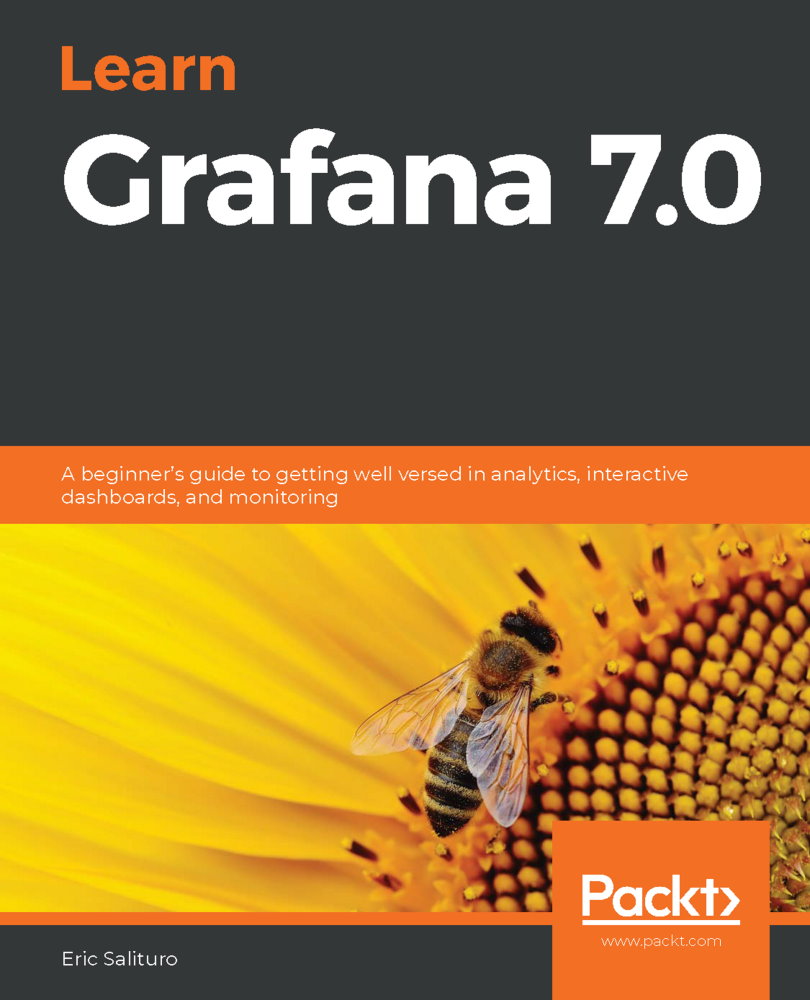
Eric Salituro - Learn Grafana 7.0: A beginners guide to getting well versed in analytics, interactive dashboards, and monitoring

Here you can read online Eric Salituro - Learn Grafana 7.0: A beginners guide to getting well versed in analytics, interactive dashboards, and monitoring full text of the book (entire story) in english for free. Download pdf and epub, get meaning, cover and reviews about this ebook. year: 2020, publisher: Packt Publishing, genre: Home and family. Description of the work, (preface) as well as reviews are available. Best literature library LitArk.com created for fans of good reading and offers a wide selection of genres:

Romance novel Science fiction Adventure Detective Science History Home and family Prose Art Politics Computer Non-fiction Religion Business Children Humor

Choose a favorite category and find really read worthwhile books. Enjoy immersion in the world of imagination, feel the emotions of the characters or learn something new for yourself, make an fascinating discovery.

No cover
  • Book:
    Learn Grafana 7.0: A beginners guide to getting well versed in analytics, interactive dashboards, and monitoring
  • Author:
  • Publisher:
    Packt Publishing
  • Genre:
  • Year:
    2020
  • Rating:
    4 / 5
  • Favourites:
    Add to favourites
  • Your mark:
    • 80
    • 1
    • 2
    • 3
    • 4
    • 5

Learn Grafana 7.0: A beginners guide to getting well versed in analytics, interactive dashboards, and monitoring: summary, description and annotation

We offer to read an annotation, description, summary or preface (depends on what the author of the book "Learn Grafana 7.0: A beginners guide to getting well versed in analytics, interactive dashboards, and monitoring" wrote himself). If you haven't found the necessary information about the book — write in the comments, we will try to find it.

A comprehensive introduction to help you get up and running with creating interactive dashboards to visualize and monitor time-series data in no time

Key Features
  • Install, set up, and configure Grafana for real-time data analysis and visualization
  • Visualize and monitor data using data sources such as InfluxDB, Prometheus, and Elasticsearch
  • Explore Grafanas multi-cloud support with Microsoft Azure, Amazon CloudWatch, and Google Stackdriver
Book Description

Grafana is an open-source analytical platform used to analyze and monitoring time-series data. This beginners guide will help you get to grips with Grafanas new features for querying, visualizing, and exploring metrics and logs no matter where they are stored.

The book begins by showing you how to install and set up the Grafana server. Youll explore the working mechanism of various components of the Grafana interface along with its security features, and learn how to visualize and monitor data using, InfluxDB, Prometheus, Logstash, and Elasticsearch. This Grafana book covers the advanced features of the Graph panel and shows you how Stat, Table, Bar Gauge, and Text are used. Youll build dynamic dashboards to perform end-to-end analytics and label and organize dashboards into folders to make them easier to find. As you progress, the book delves into the administrative aspects of Grafana by creating alerts, setting permissions for teams, and implementing user authentication. Along with exploring Grafanas multi-cloud monitoring support, youll also learn about Grafana Loki, which is a backend logger for users running Prometheus and Kubernetes.

By the end of this book, youll have gained all the knowledge you need to start building interactive dashboards.

What you will learn
  • Find out how to visualize data using Grafana
  • Understand how to work with the major components of the Graph panel
  • Explore mixed data sources, query inspector, and time interval settings
  • Discover advanced dashboard features such as annotations, templating with variables, dashboard linking, and dashboard sharing techniques
  • Connect user authentication to Google, GitHub, and a variety of external services
  • Find out how Grafana can provide monitoring support for cloud service infrastructures
Who this book is for

This book is for business intelligence developers, business analysts, data analysts, and anyone interested in performing time-series data analysis and monitoring using Grafana. Those looking to create and share interactive dashboards or looking to get up to speed with the latest features of Grafana will also find this book useful. Although no prior knowledge of Grafana is required, basic knowledge of data visualization and some experience in Python programming will help you understand the concepts covered in the book.

Table of Contents
  1. Introduction to Data Visualization with Grafana
  2. A Tour of the Grafana Interface
  3. An Introduction to the Graph Panel
  4. Connecting Grafana to a Data Source
  5. Visualizing Data in the Graph Panel
  6. Visualization Panels In Grafana
  7. Creating your First Dashboard
  8. Working with Advanced Dashboard Features
  9. Grafana Alerting
  10. Exploring Logs With Grafanas Loki
  11. Organizing Dashboards
  12. Managing Permissions For Users and Teams
  13. Authentication with External Services
  14. Cloud Monitoring

Eric Salituro: author's other books


Who wrote Learn Grafana 7.0: A beginners guide to getting well versed in analytics, interactive dashboards, and monitoring? Find out the surname, the name of the author of the book and a list of all author's works by series.

Learn Grafana 7.0: A beginners guide to getting well versed in analytics, interactive dashboards, and monitoring — read online for free the complete book (whole text) full work

Below is the text of the book, divided by pages. System saving the place of the last page read, allows you to conveniently read the book "Learn Grafana 7.0: A beginners guide to getting well versed in analytics, interactive dashboards, and monitoring" online for free, without having to search again every time where you left off. Put a bookmark, and you can go to the page where you finished reading at any time.

Light

Font size:

Reset

Interval:

Bookmark:

Make
Learn Grafana 70 A beginners guide to getting well versed in analytics - photo 1
Learn Grafana 7.0
A beginner's guide to getting well versed in analytics, interactive dashboards, and monitoring
Eric Salituro

BIRMINGHAM - MUMBAI Packtcom Subscribe to our online digital library for - photo 2

BIRMINGHAM - MUMBAI
Packtcom Subscribe to our online digital library for full access to over 7000 - photo 3

Packt.com

Subscribe to our online digital library for full access to over 7,000 books and videos, as well as industry leading tools to help you plan your personal development and advance your career. For more information, please visit our website.

Why subscribe?
  • Spend less time learning and more time coding with practical eBooks and Videos from over 4,000 industry professionals

  • Improve your learning with Skill Plans built especially for you

  • Get a free eBook or video every month

  • Fully searchable for easy access to vital information

  • Copy and paste, print, and bookmark content

Did you know that Packt offers eBook versions of every book published, with PDF and ePub files available? You can upgrade to the eBook version at www.packt.com and as a print book customer, you are entitled to a discount on the eBook copy. Get in touch with us at customercare@packtpub.com for more details.

At www.packt.com , you can also read a collection of free technical articles, sign up for a range of free newsletters, and receive exclusive discounts and offers on Packt books and eBooks.

Learn Grafana 7.0

Copyright 2020 Packt Publishing

All rights reserved. No part of this book may be reproduced, stored in a retrieval system, or transmitted in any form or by any means, without the prior written permission of the publisher, except in the case of brief quotations embedded in critical articles or reviews.

Every effort has been made in the preparation of this book to ensure the accuracy of the information presented. However, the information contained in this book is sold without warranty, either express or implied. Neither the author, nor Packt Publishing or its dealers and distributors, will be held liable for any damages caused or alleged to have been caused directly or indirectly by this book.

Packt Publishing has endeavored to provide trademark information about all of the companies and products mentioned in this book by the appropriate use of capitals. However, Packt Publishing cannot guarantee the accuracy of this information.

Commissioning Editor: Mrinmayee Kawalkar
Acquisition Editor: Devika Battike
Content Development Editor: Sean Lobo
Senior Editor: David Sugarman
Technical Editor: Utkarsha S. Kadam
Copy Editor: Safis Editing
Project Coordinator: Aishwarya Mohan
Proofreader: Safis Editing
Indexer: Priyanka Dhadke
Production Designer: Joshua Misquitta

First published: June 2020

Production reference: 1240620

Published by Packt Publishing Ltd.
Livery Place
35 Livery Street
Birmingham
B3 2PB, UK.

ISBN 978-1-83882-658-1

www.packt.com

About the author

Eric Salituro is currently a senior software engineer with the enterprise data and analytics platform team at Zendesk. He has an IT career that spans more than 30 years, over 20 of which were spent in the motion picture industry working as a pipeline technical director and software developer for innovative and creative studios such as DreamWorks, Digital Domain, and Pixar. Before moving to Zendesk, he worked at Pixar, helping to manage and maintain their production render farm as a senior software developer. Among his accomplishments is the development of a Python API toolkit for Grafana aimed at streamlining the creation of rendering metrics dashboards.

About the reviewers

imon Podlipsk is a software development engineer with a master's degree in management and software quality management from the University of Economics in Prague. His passion is contributing to open source software, including Grafana. He also maintains and develops the Grafana JSON data source, which you can try out yourself after finishing the book.

Hugh O'Brien is a 15-year veteran of cloud infrastructure and performance monitoring. He is Head of Infrastructure at Thrive Global and has previously worked at Zendesk, Jet.com and Intel. His presentation at Kafka Summit 2018 "ZFS: Better Living Through Filesystems" (viewable online) is basically just a sequence of Grafana screenshots. He has, for no discernible reason, used Grafana/Prometheus to instrument his home router (Wi-Fi RSSI as radar), android phone (XYZ accelerometery for activity detection), and soon his cars CAN bus (emissions, maybe?). He holds a degree in Computer Engineering from his hometown of Limerick, Ireland, and is the only living person who knows the origins of the 2.4GHz ISM band.

Packt is searching for authors like you

If you're interested in becoming an author for Packt, please visit authors.packtpub.com and apply today. We have worked with thousands of developers and tech professionals, just like you, to help them share their insight with the global tech community. You can make a general application, apply for a specific hot topic that we are recruiting an author for, or submit your own idea.

Preface

Grafana is an open source analytics platform used to analyze and monitor time-series data. This beginner's guide will help you get to grips with Grafana's new features for querying, visualizing, and exploring metrics and logs, regardless of where they are stored.

This book begins by showing you how to install and set up the Grafana server. You'll explore the workings of various components of the Grafana interface, along with its security features, and you will learn how to visualize and monitor data using InfluxDB, Prometheus, Logstash, and Elasticsearch. This Grafana book covers the advanced features of the Graph panel and shows you how Stat , Table , Bar , Gauge , and Text are used. You'll build dynamic dashboards to perform end-to-end analytics and label and organize dashboards into folders to make them easier to find. As you progress through it, this book delves into the administrative aspects of Grafana by creating alerts, setting permissions for teams, and implementing user authentication. Along with exploring Grafana's multi-cloud monitoring support, you'll also learn about Grafana's Loki system, which is a backend logger for users running Prometheus and Kubernetes.

By the end of this book, you'll have gained all the knowledge you need to start building interactive dashboards.

Who this book is for

This book is for business intelligence developers, business analysts, data analysts, and anyone interested in performing time-series data analysis and monitoring using Grafana. Those looking to create and share interactive dashboards or looking to get up to speed with the latest features of Grafana will also find this book useful. Although no prior knowledge of Grafana is required, basic knowledge of data visualization and some experience with Python programming will help you understand the concepts covered in this book.

Next page
Light

Font size:

Reset

Interval:

Bookmark:

Make

Similar books «Learn Grafana 7.0: A beginners guide to getting well versed in analytics, interactive dashboards, and monitoring»

Look at similar books to Learn Grafana 7.0: A beginners guide to getting well versed in analytics, interactive dashboards, and monitoring. We have selected literature similar in name and meaning in the hope of providing readers with more options to find new, interesting, not yet read works.


Reviews about «Learn Grafana 7.0: A beginners guide to getting well versed in analytics, interactive dashboards, and monitoring»

Discussion, reviews of the book Learn Grafana 7.0: A beginners guide to getting well versed in analytics, interactive dashboards, and monitoring and just readers' own opinions. Leave your comments, write what you think about the work, its meaning or the main characters. Specify what exactly you liked and what you didn't like, and why you think so.