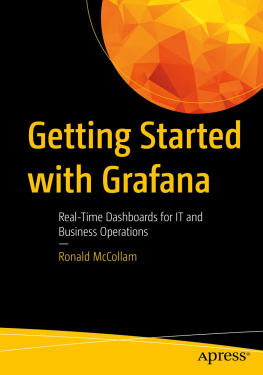
Unknown - Getting Started with Grafana : real-time dashboards for monitoring business operations.
Here you can read online Unknown - Getting Started with Grafana : real-time dashboards for monitoring business operations. full text of the book (entire story) in english for free. Download pdf and epub, get meaning, cover and reviews about this ebook. year: 2022, publisher: Apress, genre: Home and family. Description of the work, (preface) as well as reviews are available. Best literature library LitArk.com created for fans of good reading and offers a wide selection of genres:
Romance novel
Science fiction
Adventure
Detective
Science
History
Home and family
Prose
Art
Politics
Computer
Non-fiction
Religion
Business
Children
Humor
Choose a favorite category and find really read worthwhile books. Enjoy immersion in the world of imagination, feel the emotions of the characters or learn something new for yourself, make an fascinating discovery.
- Book:Getting Started with Grafana : real-time dashboards for monitoring business operations.
- Author:
- Publisher:Apress
- Genre:
- Year:2022
- Rating:4 / 5
- Favourites:Add to favourites
- Your mark:
- 80
- 1
- 2
- 3
- 4
- 5
Getting Started with Grafana : real-time dashboards for monitoring business operations.: summary, description and annotation
We offer to read an annotation, description, summary or preface (depends on what the author of the book "Getting Started with Grafana : real-time dashboards for monitoring business operations." wrote himself). If you haven't found the necessary information about the book — write in the comments, we will try to find it.
Unknown: author's other books
Who wrote Getting Started with Grafana : real-time dashboards for monitoring business operations.? Find out the surname, the name of the author of the book and a list of all author's works by series.
Getting Started with Grafana : real-time dashboards for monitoring business operations. — read online for free the complete book (whole text) full work
Below is the text of the book, divided by pages. System saving the place of the last page read, allows you to conveniently read the book "Getting Started with Grafana : real-time dashboards for monitoring business operations." online for free, without having to search again every time where you left off. Put a bookmark, and you can go to the page where you finished reading at any time.
Font size:
Interval:
Bookmark:
 Getting Started withGrafanaReal-Time Dashboards for ITand Business OperationsRonald McCollamGetting Started with Grafana: Real-Time Dashboards for IT and Business Operations Ronald McCollam Somerville, MA, USA ISBN-13 (pbk): 978-1-4842-8308-0 ISBN-13 (electronic): 978-1-4842-8309-7 https://doi.org/10.1007/978-1-4842-8309-7 Copyright 2022 by Ronald McCollam This work is subject to copyright. All rights are reserved by the Publisher, whether the whole or part of the material is concerned, specifically the rights of translation, reprinting, reuse of illustrations, recitation, broadcasting, reproduction on microfilms or in any other physical way, and transmission or information storage and retrieval, electronic adaptation, computer software, or by similar or dissimilar methodology now known or hereafter developed. Trademarked names, logos, and images may appear in this book. Rather than use a trademark symbol with every occurrence of a trademarked name, logo, or image we use the names, logos, and images only in an editorial fashion and to the benefit of the trademark owner, with no intention of infringement of the trademark. The use in this publication of trade names, trademarks, service marks, and similar terms, even if they are not identified as such, is not to be taken as an expression of opinion as to whether or not they are subject to proprietary rights. While the advice and information in this book are believed to be true and accurate at the date of publication, neither the authors nor the editors nor the publisher can accept any legal responsibility for any errors or omissions that may be made.
The publisher makes no warranty, express or implied, with respect to the material contained herein. Managing Director, Apress Media LLC: Welmoed Spahr Acquisitions Editor: Jonathan Gennick Development Editor: Laura Berendson Coordinating Editor: Gryffin Winkler Cover image designed by Freepik (www.freepik.com) Distributed to the book trade worldwide by Springer Science+Business Media LLC, 1 New York Plaza, Suite 4600, New York, NY 10004. Phone 1-800-SPRINGER, fax (201) 348-4505, e-mail orders-ny@springer-sbm. com, or visit www.springeronline.com. Apress Media, LLC is a California LLC and the sole member (owner) is Springer Science + Business Media Finance Inc (SSBM Finance Inc). SSBM Finance Inc is a Delaware corporation.
For information on translations, please e-mail booktranslations@springernature.com; for reprint, paperback, or audio rights, please e-mail bookpermissions@springernature.com. Apress titles may be purchased in bulk for academic, corporate, or promotional use. eBook versions and licenses are also available for most titles. For more information, reference our Print and eBook Bulk Sales web page at http://www.apress.com/bulk-sales. Any source code or other supplementary material referenced by the author in this book is available to readers on GitHub. Printed on acid-free paper To my partner, my friends, and family (both birth and chosen),who put up with my absence for far too many eveningsand weekends.
Thank you!Table of Contents About the Author xiii About the Technical Reviewer xv Acknowledgments xvii Introduction xix Part I: Getting Started 1 Chapter 1: Grafana Cloud 3 Creating a Grafana Cloud Account 4 A Quick Overview of the Grafana Interface 7 Navigating Grafana 8 Dashboards and Panels 9 Dashboard Options 9 Creating Your First Dashboard 10 Adding Panels 10 Working with Panels 12 Logging Out of and In to Grafana 14 Signing Out 14 Summary 17 Chapter 2: Working with Panels 19 Basic Unit of Data Visualization 19 Understanding the Edit Panel View 20 View Options 21 Data Options 22 v Table of ConTenTs Working with Data 23 Panel Options 24 Common Panel Options 24 Panel Types 28 Time Series 29 Bar Chart 30 Stat 31 Gauge and Bar Gauge 32 Table 32 Pie Chart 33 State Timeline and Status History 34 Heatmap and Histogram 35 Text 36 Geomap 37 Node Graph 38 Others 39 Finding Other Visualizations 39 Summary 40 Part II: Deploying and Managing Grafana 43 Chapter 3: Deploying Grafana Locally 45 Linux 46 Debian (Including Ubuntu) 47 Red Hat (Including Fedora and CentOS) 51 Other Linux 57 Windows 61 MacOS 68 Docker 75 Raspberry Pi 79 Summary 87 vi Table of ConTenTs Chapter 4: Connecting to Data Sources 89 Managing Data Sources 91 Testdata DB 93 InfluxDB 96 Prometheus 104 Graphite 108 MySQL 112 PostgreSQL 116 Loki 119 Elasticsearch 123 Installing Other Data Sources 128 Summary 130 Chapter 5: User Administration 131 User Roles 131 Managing Users 132 Adding or Removing Users 133 Changing User Roles 139 Teams 140 Managing Permissions 143 Grafana Organizations 148 Summary 152 Part III: Making Things Useful 153 Chapter 6: Dashboard Design 155 Choosing Data 157 Audience 157 Data 158 Context 159 Composing a Visualization 161 Surfacing the Most Important Data First 164 vii Table of ConTenTs Adding More Context 165 Exposing Detail with Rows 167 Adding Rows 169 Configuring and Deleting Rows 170 Moving Rows 171 Moving Panels In and Out of Rows 172 Using Multiple Rows 173 Organizing Dashboards 173 Folders 173 Tags 175 Finding Dashboards 176 Summary 177 Chapter 7: Workflow 179 Overviews vs Details 179 Links 180 Panel Links 181 Data Links 184 The Explore View 187 Getting into the Explore View 188 Using the Explore View 189 Reusability with Library Panels 193 Adding a Panel to the Library 193 Using a Library Panel in a Dashboard 195 Managing Library Panels 196 Updating Library Panels 197 Unlinking Library Panels 198 Summary 199 Chapter 8: Working with Multiple Data Sources 201 Side by Side 201 Keeping Things Consistent 202 Staying in Sync 204 viii Table of ConTenTs In-Panel 205 The Mixed Data Source 206 Dealing with Multiple Axes 207 Calculating New Data 209 Math with Expressions 209 Math with the Add Field Transform 211 Summary 212 Chapter 9: Advanced Panels 215 Panel Overrides 215 Adding Overrides 215 Using Override Properties 220 Removing Overrides and Override Properties 222 Transformations 223 Managing Transformations 224 Commonly Used Transformations 227 Summary 240 Chapter 10: Dashboard Variables 243 Managing Variables 243 Defining Variables 245 More Advanced Variables 248 Custom Variables 250 Key/Value Pairs in Custom Variables 252 Query Variables 253 Data Source Variables 256 Chaining Variables 258 Repeating Panels with Variables 260 Variables in URLs 262 Passing Variables Between Dashboards 262 Linking from External Tools 263 Summary 263 ix Table of ConTenTs Chapter 11: Alerting 265 Alerting Configuration 266 Alert Rules 266 Contact Points 268 Notification Policies 271 Silences 274 Creating Alerts 275 Rule Type 277 Query to Be Alerted On 278 Alert Conditions 279 Alert Details 280 Summary 281 Part IV: Advanced Grafana 283 Chapter 12: Advanced Deployment and Management 285 External Grafana Databases 285 MySQL/MariaDB 286 PostgreSQL 288 High Availability Deployments 289 Image Rendering Service 291 Deploying the Rendering Service 292 Configuring Grafana to Use the Remote Renderer 293 Backup and Restore 295 Backing Up 295 Restoring 297 Advanced Authentication 299 LDAP and Active Directory 300 OAuth 305 Summary 310 x Table of ConTenTs Chapter 13: Programmatic Grafana 311 REST APIs 311 Using a REST API Client 312 Managing Grafana API Keys 313 Adding API Keys 314 Deleting API Keys 316 Using API Keys 317 The Grafana API 319 Dashboards 319 Folders 322 Data Sources 328 Miscellaneous 332 Grafana Provisioning 334 Provisioning Overview 334 Data Sources 335 Dashboards 336 Summary 337 Chapter 14: Grafana Enterprise 339 Enterprise Data Sources 340 Enterprise Security 342 Data Source Permissions 342 Fine-Grained Access Control 345 Enterprise Access and Authorization 346 Enhanced LDAP 346 SAML Support 348 Scheduled Reporting 348 Dashboard Insights 351 Changing Grafanas Appearance 352 Summary 353 Index 355 xi 
Font size:
Interval:
Bookmark:
Similar books «Getting Started with Grafana : real-time dashboards for monitoring business operations.»
Look at similar books to Getting Started with Grafana : real-time dashboards for monitoring business operations.. We have selected literature similar in name and meaning in the hope of providing readers with more options to find new, interesting, not yet read works.
Discussion, reviews of the book Getting Started with Grafana : real-time dashboards for monitoring business operations. and just readers' own opinions. Leave your comments, write what you think about the work, its meaning or the main characters. Specify what exactly you liked and what you didn't like, and why you think so.


