Reza Shadmehr - Vigor: Neuroeconomics of Movement Control
Here you can read online Reza Shadmehr - Vigor: Neuroeconomics of Movement Control full text of the book (entire story) in english for free. Download pdf and epub, get meaning, cover and reviews about this ebook. year: 2020, publisher: MIT Press, genre: Home and family. Description of the work, (preface) as well as reviews are available. Best literature library LitArk.com created for fans of good reading and offers a wide selection of genres:
Romance novel
Science fiction
Adventure
Detective
Science
History
Home and family
Prose
Art
Politics
Computer
Non-fiction
Religion
Business
Children
Humor
Choose a favorite category and find really read worthwhile books. Enjoy immersion in the world of imagination, feel the emotions of the characters or learn something new for yourself, make an fascinating discovery.

- Book:Vigor: Neuroeconomics of Movement Control
- Author:
- Publisher:MIT Press
- Genre:
- Year:2020
- Rating:4 / 5
- Favourites:Add to favourites
- Your mark:
- 80
- 1
- 2
- 3
- 4
- 5
Vigor: Neuroeconomics of Movement Control: summary, description and annotation
We offer to read an annotation, description, summary or preface (depends on what the author of the book "Vigor: Neuroeconomics of Movement Control" wrote himself). If you haven't found the necessary information about the book — write in the comments, we will try to find it.
Vigor: Neuroeconomics of Movement Control — read online for free the complete book (whole text) full work
Below is the text of the book, divided by pages. System saving the place of the last page read, allows you to conveniently read the book "Vigor: Neuroeconomics of Movement Control" online for free, without having to search again every time where you left off. Put a bookmark, and you can go to the page where you finished reading at any time.
Font size:
Interval:
Bookmark:
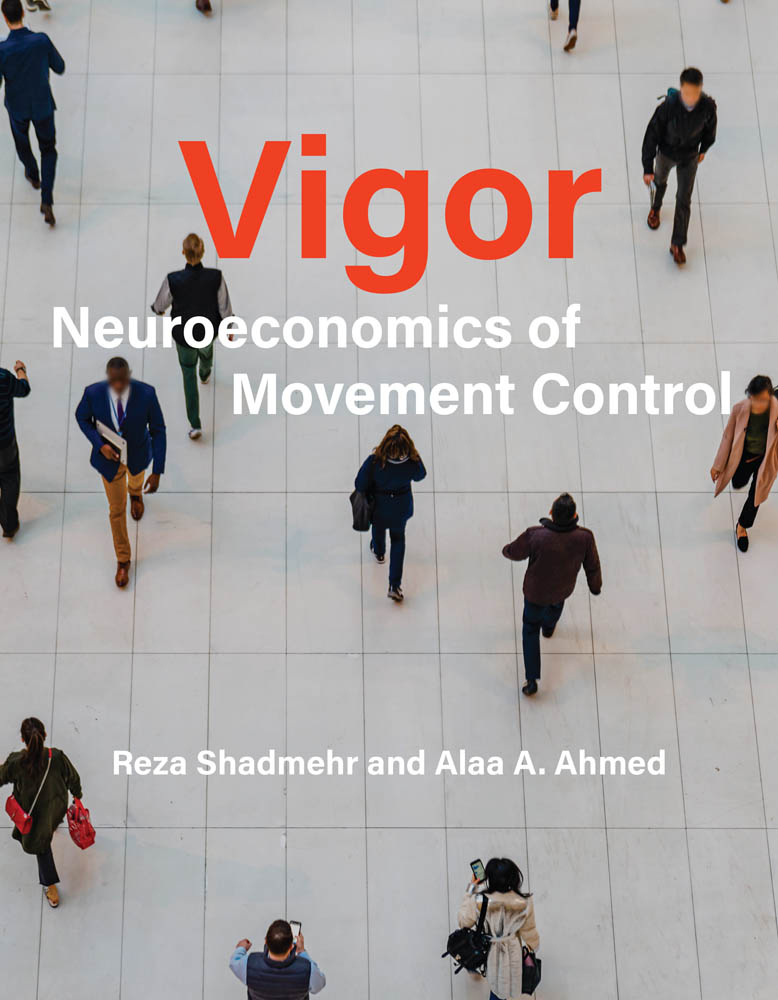
Vigor
Neuroeconomics of Movement Control
Reza Shadmehr and Alaa A. Ahmed
The MIT Press
Cambridge, Massachusetts
London, England
2020 Reza Shadmehr and Alaa A. Ahmed
All rights reserved. No part of this book may be reproduced in any form by any electronic or mechanical means (including photocopying, recording, or information storage and retrieval) without permission in writing from the publisher.
Library of Congress Cataloging-in-Publication Data
Names: Shadmehr, Reza, author.
Title: Vigor : neuroeconomics of movement control / Reza Shadmehr and Alaa A. Ahmed.
Description: Cambridge, Massachusetts : The MIT Press, [2020] | Includes bibliographical references and index.
Identifiers: LCCN 2019041223 | ISBN 9780262044059 (hardcover)
Subjects: LCSH: Reaction time--Physiological aspects. | Reward (Psychology)--Physiological aspects. | Decision making--Physiological aspects.
Classification: LCC BF317 .S48 2020 | DDC 152.8/3--dc23
LC record available at https://lccn.loc.gov/20190412
d_r0
Energy consumption during walking and natural walking speeds. A. Rate of energy consumption (normalized to weight) as a function of average walking speed, as measured over a period of 10 minutes while the subjects (healthy volunteers, average age of 32 years) walked around a track. (Data from Ralston, 1958.) B. Cost of transport: rate of energy consumption divided by mass and divided by average velocity. This is the energy expended to transport 1 kg of mass a distance of 1 cm. The curve labeled Control is for the data shown in part A. Curve labeled Prosthesis is for an individual who walked with a well fitted prosthetic leg. Curve labeled Crutches is for the same individual who walked with crutches. The circles are the measured data points. The arrows indicate the walking speed that minimizes cost of transport. C. Preferred walking speed of pedestrians as measured in 15 cities around the world. Preferred walking speed of pedestrians in large cities is twice as fast as those in small towns. (Data are from Bornstein and Bornstein, 1976.)
Speed of locomotion and its energetics in horses. A. Oxygen cost to move a unit distance (cost of transport) is illustrated for one horse. The minimum oxygen cost to move a unit distance was approximately the same in all three gaits. B. Gaits for which the horse was allowed to select its own speed while running on ground. For each gait, the animal chose to move near the speed that minimized cost of transport. (Data from Hoyt and Taylor, 1981.)
Energetics sand step frequency. Energy expenditure was measured in seven male subjects as they walked on a treadmill at a fixed speed of 1.5 m/s. Subjects walked at prescribed step frequencies both greater and less than their freely chosen step frequency. Triangles indicate the energetic expenditure for each subject at their freely chosen step frequency. Subjects tended to freely select a step frequency that approximated the energetic minimum. (Data from Zarrugh and Radcliffe, 1978.)
Energetic cost of reaching. A. Rate of energetic consumption during reaching movements to various distances and durations. Movements were made in a horizontal plane with the weight of the arm supported. B. Total energy consumed to reach a given distance as a function of reach duration. The optimum duration is specified by the filled circle. (Data from Shadmehr et al., 2016.)
Energetic cost of driving a car (1986 Volkswagen Golf GTI). A. Fuel efficiency Miles per gallon as a function of driving speed. Numbers indicate the gear ratio. B. Total fuel consumption to drive 1 mile as a function of time. (Data from www.metrompg.com/posts/speed-vs-mpg.htm.)
Energetics and utility of walking. A. Energy consumed to walk a distance of 50 m for a person of weight 75 kg, a = 29 cal/min/kg, and b = 0.0053 cal.min/kg/m2. B. Utility of the movement. The curves are the temporally discounted reward and the metabolic cost of walking, plotted as a function of movement duration. The center curve is the utility, which is the sum of the temporally discounted reward and metabolic cost. The utility is mostly a positive function of duration, indicating that the movement will produce a greater amount of reward than effort and therefore is worth performing. It has a peak (black circle) corresponding to the duration of movement that maximizes the utility. This plot was generated by using the metabolic cost shown in part A, with = 1 and reward = 5 kcal.
Utility of walking as temporally discounted sum of reward and effort. The baseline simulation (black curve) is the utility of a 75 kg person to walk distance of 50 m, for reward = 5 kcal, with = 1. A. With increased reward, the maximum utility increases. In addition, the optimal duration shifts to a smaller value. As a result, a stimulus that promises greater reward not only carries a greater utility, but produces a movement that has greater velocity (reduced duration). B. The effort of the movement is increased by increasing the mass of the moving object. An increased mass decreases the maximum utility of the movement, but also shifts the optimal duration to a larger value, thereby decreasing the speed of the resulting movement. C. The effect of increased rate of temporal discounting. Increasing the rate of temporal discounting decreases the maximum utility of the movement, but also shifts the optimal duration to a smaller value, thereby increasing movement velocity. D. Utility as a function of average speed of walking (all variables except distance are kept constant). As distance increases, the maximum utility decreases. The optimum speed of walking is slower for longer distances. At large distances, the entire utility function is negative. In this case, the best option is to reject the reward and choose not to walk.
Utility of reaching as temporally discounted sum of reward and effort. The baseline simulation (black curve) is the utility of reaching a distance of 20 cm for reward = 0.5 KJ with = 1. A. Temporally discounted reward, effort, and utility. B. When reward value increases, the maximum utility increases, but there is also a reduction in the optimum duration. That is, an increase reward value causes a faster reaching movement. C. An increase in distance reduces the maximum utility and increases the optimum duration. D. Increased impulsivity reduces the maximum utility and decreases the optimum duration. E. The speed that minimizes the energetic cost of reaching (dashed line), and the speed that maximizes the utility of reaching (solid gray lines). The dark black lines display preferred reaching speeds from human subjects, from (de Grosbois et al., 2015). Reaching speeds are typically faster than the speed that minimizes energetic expenditure. That is, the value of the reward makes it worthwhile to spend energy.
Metabolic cost of isometric force production. A. Force response of the gastrocnemius muscle to surface stimulation of various durations in a typical subject. B. Total ATP consumed as a function of stimulation duration. C. Using the force response curves in part A, we plotted the ATP consumed as a function of the force-time integral. Energy consumption is an approximately linear function of the force-time integral. (Data from Russ et al., 2002.)
Font size:
Interval:
Bookmark:
Similar books «Vigor: Neuroeconomics of Movement Control»
Look at similar books to Vigor: Neuroeconomics of Movement Control. We have selected literature similar in name and meaning in the hope of providing readers with more options to find new, interesting, not yet read works.
Discussion, reviews of the book Vigor: Neuroeconomics of Movement Control and just readers' own opinions. Leave your comments, write what you think about the work, its meaning or the main characters. Specify what exactly you liked and what you didn't like, and why you think so.


