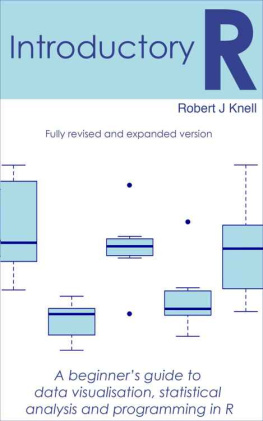
Knell - Introductory R: A Beginners Guide to Data Visualisation, Statistical Analysis and Programming in R
Here you can read online Knell - Introductory R: A Beginners Guide to Data Visualisation, Statistical Analysis and Programming in R full text of the book (entire story) in english for free. Download pdf and epub, get meaning, cover and reviews about this ebook. City: Hersham;Walton on Thames;UK, year: 2014;2013, publisher: Rob Knell School of Biological and Chemical Sciences Queen Mary University of London, genre: Home and family. Description of the work, (preface) as well as reviews are available. Best literature library LitArk.com created for fans of good reading and offers a wide selection of genres:
Romance novel
Science fiction
Adventure
Detective
Science
History
Home and family
Prose
Art
Politics
Computer
Non-fiction
Religion
Business
Children
Humor
Choose a favorite category and find really read worthwhile books. Enjoy immersion in the world of imagination, feel the emotions of the characters or learn something new for yourself, make an fascinating discovery.
- Book:Introductory R: A Beginners Guide to Data Visualisation, Statistical Analysis and Programming in R
- Author:
- Publisher:Rob Knell School of Biological and Chemical Sciences Queen Mary University of London
- Genre:
- Year:2014;2013
- City:Hersham;Walton on Thames;UK
- Rating:3 / 5
- Favourites:Add to favourites
- Your mark:
- 60
- 1
- 2
- 3
- 4
- 5
Introductory R: A Beginners Guide to Data Visualisation, Statistical Analysis and Programming in R: summary, description and annotation
We offer to read an annotation, description, summary or preface (depends on what the author of the book "Introductory R: A Beginners Guide to Data Visualisation, Statistical Analysis and Programming in R" wrote himself). If you haven't found the necessary information about the book — write in the comments, we will try to find it.
Knell: author's other books
Who wrote Introductory R: A Beginners Guide to Data Visualisation, Statistical Analysis and Programming in R? Find out the surname, the name of the author of the book and a list of all author's works by series.
Introductory R: A Beginners Guide to Data Visualisation, Statistical Analysis and Programming in R — read online for free the complete book (whole text) full work
Below is the text of the book, divided by pages. System saving the place of the last page read, allows you to conveniently read the book "Introductory R: A Beginners Guide to Data Visualisation, Statistical Analysis and Programming in R" online for free, without having to search again every time where you left off. Put a bookmark, and you can go to the page where you finished reading at any time.
Font size:
Interval:
Bookmark:
Table of Contents
Introductory R
A beginners guide to data visualisation and statistical analysis and programming in R
Rob Knell School of Biological and Chemical Sciences Queen Mary University of London
Published by Robert Knell, Hersham, Walton on Thames United Kingdom KT12 5RH
Copyright Robert Knell 2014
All rights reserved. No part of this book may be reproduced, stored in a retrieval system or transmitted at any time or by any means mechanical, electronic, photocopying, recording or otherwise without the prior written agreement of the publisher.
The right of Robert Knell to be identified as the author of this work has been asserted by him in accordance with the copyright, designs and patents act 1988
First printed March 2013
ISBN 978-0-9575971-1-2
Preface
Ive been using R to analyse my data for about twelve years now, and about eight years ago I started running an informal course for postgraduates, postdocs and on occasions academics at Queen Mary, University of London to teach them how to use it. More recently we have started trying to teach R to our undergraduates, with more success than I think wed originally expected. This book has slowly arisen from a set of course notes that I originally wrote for the postgraduate course, and has since been field-tested on the undergraduate course. Ive decided to self-publish it as an e-book for several reasons. Firstly, its an interesting experiment. Secondly, it keeps the price down to roughly 20% of the cost of a book published in the traditional way. Thirdly, it leaves me with complete control over the content of the book, where its available and whats included in it.
This book is written from the perspective of a biologist, and the examples given are mostly either biological or medical ones. The basic principles of the analyses presented are universal, however, and Ive made an effort to explain the examples in such a way that I hope most people will understand them. Nonetheless, if youre more used to data from other fields then you might have some difficulty following some of the examples, in which case Im sorry. Please drop me a line () and let me know if you think one or more of the examples used are particularly opaque and Ill try to take your feedback into account.
This book was written with Sublime Text using R markdown . Conversion to html was done in R using knitr and final html editing and formatting was done in Sigil. For the kindle version .mobi conversion was done using Calibre. My thanks to those who have worked hard to make these outstanding tools available either for free or for very reasonable prices.
How to use this book
You can read this on anything you can read an ebook on, depending on the exact format of the copy you have bought. Because there are a lot of figures you might find some parts of it don't display particularly well on a small ebook reader, so the best thing to read this on is probably a tablet - an iPad or a reasonably sized Android tablet. These have decent sized high-res screens and the code and figures should all come out properly. If you try to read it on a smaller ebook reader you won't be able to see the colours and some of the figures won't look too great, but the rest should be OK.
The R code is presented in a monospace font. For formats that aren't read on a Kindle code that is entered into R is coloured blue and presented with a pale blue background and output from R comes with a white background. Kindle formatting can't cope with the background, so input code is blue and output code is either black or blue-black depending on your reader.
This is code that is input into R This is R outputSome of the R output is in fairly big tables or matrices which might be hard to read if you have your font size set too large because the lines will wrap round and make it difficult to read the table. If this happens you'll might like to drop the font size you're using to make the table behave. If you'd rather not then you should be able to make sense of the tables anyway but it might require a little thinking.
The structure of the book is, I hope, fairly self-evident. The first five chapters introduce and explain some of the fundamental concepts of R (e.g. basic use of the console, importing data, record Keeping, graphics).Chapters 6-13 are about statistics and how to analyse data in R. We start with basic concepts and go through a series of analyses from chi-squared tests to general linear model fitting. All of these are illustrated with examples using real data sets and the way to carry out these analyses in R is explained in detail, as is how to interpret the output - the latter is often more complicated than the former. Finally, chapters 14 to 19 are about programming in R, with the last two chapters being two reasonably complex worked examples.
The chapters which are most focussed on how to use R, rather than statistics, have exercises for you to work through yourself. These are Chapter 2, Chapter 5 and Chapters 14-17. The solutions to all of the exercises are in Appendix 4.
The data used for the examples is a mix of data from classic studies, data from recent surveys published by the government, data from my own research and data thats been extracted from publications or made available publicly by the authors of recent publications. Id just like to take this opportunity to point out the fabulous resource that is the Dryad digital repository (http://datadryad.org) and encourage anyone who reads this to upload data from their publications to it. Because Ive made an effort to use real data for many of the examples in this book you will see analyses worked out on warts-and-all data, with the kinds of problems and uncertainties that arise when were dealing with data from real research. Some books will show you examples based on the analysis of made-up data which behaves perfectly. I do this to some extent but I try to avoid the danger of giving a false impression of the realities of data analysis: I think it's important to understand that its rare to end up with a set of results that behaves nicely and plays properly with your analysis in every way.
If you are reading this on a tablet then remember that you can double-tap on a figure (or one of the output tables imported as a figure) to get a bigger version displayed.
There is a website for the book at http://www.introductoryr.co.uk where you can download datasets and scripts associated with the analyses presented here.
Acknowledgements
Id just like to thank all the staff and students at QMUL who gave feedback on the various drafts of the manuscript, especially Mark Stevenson who took a lot of time to check through the code for a previous version, Dicky Clymo and Beth Clare for comments on the previous version or on draft chapters for this version, Lucy-Rose Wyatt who helped with the conversion of the previous version to the new format and Richard Nichols for ruthlessly weeding out any wording that could possibly be interpreted as implying that rejecting a null hypothesis might mean that the alternative hypothesis is true. Thanks also to everyone who pointed out to me that "Tilda" can refer to many things including a brand of rice and a railway station in India, but that the ~ symbol is not one of those things.
Notes for the most recent version
This new version fixes a number of typos. Thanks to James Westmancoat, Linda Collins, Terry Beyer, Wylie Roger, Barry Lennon and Mark Gilbert for pointing errors out. If you find any mistakes in this version please email me (rob.knell@gmail.com) and let me know.
Chapter 1: A first R session
What is R?
In the beginning, Bell labs in the States developed a statistical analysis package called S. Nowadays this is most widely encountered as the commercially available package S-plus, distributed by Insightful corp. R is an open-source implementation of S, and differs from S-plus largely in its command-line only format. If youre not familiar with the concept, open source software is not produced and sold by commercial bodies in the way that software such as Microsoft Office is: rather, it is usually written collaboratively by teams of volunteers and then distributed for free. Its called open source because the source code is available and anyone can modify it and distribute it themselves if they conform to the requirements of the open source licence. R development is mostly done by the Core Development Team, who are listed here: http://www.r-project.org/contributors. Thanks everyone for all your hard work.
Next pageFont size:
Interval:
Bookmark:
Similar books «Introductory R: A Beginners Guide to Data Visualisation, Statistical Analysis and Programming in R»
Look at similar books to Introductory R: A Beginners Guide to Data Visualisation, Statistical Analysis and Programming in R. We have selected literature similar in name and meaning in the hope of providing readers with more options to find new, interesting, not yet read works.
Discussion, reviews of the book Introductory R: A Beginners Guide to Data Visualisation, Statistical Analysis and Programming in R and just readers' own opinions. Leave your comments, write what you think about the work, its meaning or the main characters. Specify what exactly you liked and what you didn't like, and why you think so.

