Contents
i
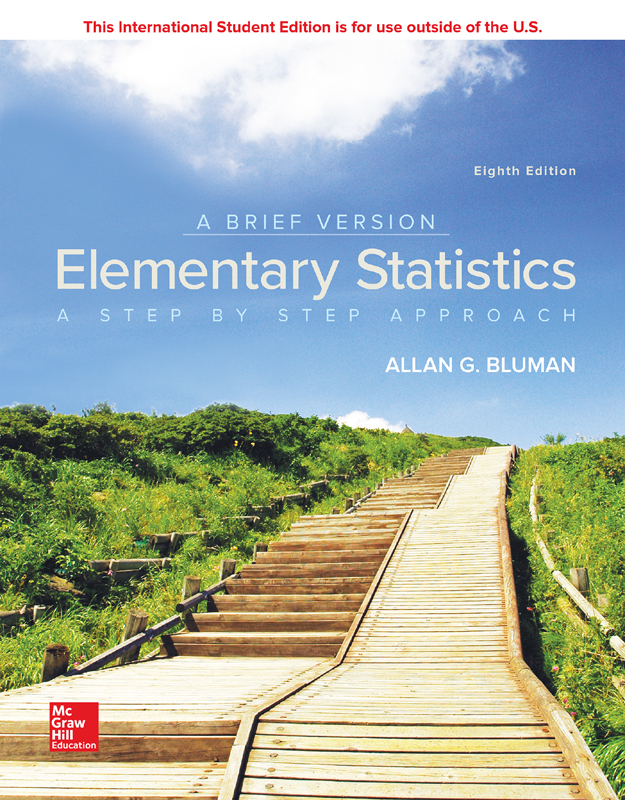
Eighth Edition
A BRIEF VERSION
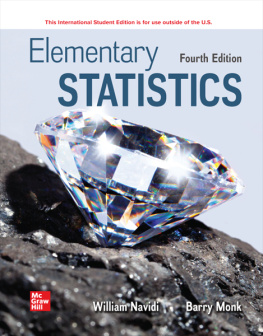
Elementary Statistics
A STEP BY STEP APPROACH

ALLAN G. BLUMAN
PROFESSOR EMERITUS
COMMUNITY COLLEGE OF ALLEGHENY COUNTY
ii

ELEMENTARY STATISTICS: A BRIEF VERSION
Published by McGraw-Hill Education, 2 Penn Plaza, New York, NY 10121. Copyright 2019 by McGraw-Hill Education. All rights reserved. Printed in the United States of America. No part of this publication may be reproduced or distributed in any form or by any means, or stored in a database or retrieval system, without the prior written consent of McGraw-Hill Education, including, but not limited to, in any network or other electronic storage or transmission, or broadcast for distance learning.
Some ancillaries, including electronic and print components, may not be available to customers outside the United States.
This book is printed on acid-free paper.
1 2 3 4 5 6 7 8 9 LMN 21 20 19 18
ISBN 978-1-260-09255-4
MHID 1-260-09255-0
Cover Image: Spaces Images/Blend Images
All credits appearing on page or at the end of the book are considered to be an extension of the copyright page.
The Internet addresses listed in the text were accurate at the time of publication. The inclusion of a website does not indicate an endorsement by the authors or McGraw-Hill Education, and McGraw-Hill Education does not guarantee the accuracy of the information presented at these sites.
mheducation.com/highered
iii
ABOUT THE AUTHOR
 | Allan G. Bluman Allan G. Bluman is a professor emeritus at the Community College of Allegheny County, South Campus, near Pittsburgh, Pennsylvania. He has taught mathematics and statistics for over 35 years. He received an Apple for the Teacher award in recognition of his bringing excellence to the learning environment at South Campus. He has also taught statistics for Penn State University at the Greater Allegheny (McKeesport) Campus and at the Monroeville Center. He received his masters and doctors degrees from the University of Pittsburgh. He is also author of Elementary Statistics and coauthor of Math in Our World. In addition, he is the author of four mathematics books in the McGraw-Hill DeMystified Series. They are Pre-Algebra, Math Word Problems, Business Math, and Probability. He is married and has two sons, a granddaughter, and a grandson. Dedication:To Betty Bluman, Earl McPeek, and Dr. G. Bradley Seager, Jr. |
v
CONTENTS
All examples and exercises in this textbook (unless cited) are hypothetical and are presented to enable students to achieve a basic understanding of the statistical concepts explained. These examples and exercises should not be used in lieu of medical, psychological, or other professional advice. Neither the author nor the publisher shall be held responsible for any misuse of the information presented in this textbook.
vi
vii
x2 Test for a Variance or Standard Deviation
viii
ADDITIONAL TOPICS ONLINE(www.mhhe.com/bluman)
Algebra Review
Writing the Research Report
Bayes Theorem
Alternate Approach to the Standard Normal Distribution

ix
PREFACE
Approach | Elementary Statistics:A Step by Step Approach was written as an aid in the beginning statistics course to students whose mathematical background is limited to basic algebra. The book follows a nontheoretical approach without formal proofs, explaining concepts intuitively and supporting them with abundant examples. The applications span a broad range of topics certain to appeal to the interests of students of diverse backgrounds, and they include problems in business, sports, health, architecture, education, entertainment, political science, psychology, history, criminal justice, the environment, transportation, physical sciences, demographics, eating habits, and travel and leisure. |
About This Book | While a number of important changes have been made in the eighth edition, the learning system remains untouched and provides students with a useful framework in which to learn and apply concepts. Some of the retained features include the following: |
Over 1200 exercises are located at the end of major sections within each chapter. Hypothesis-Testing Summaries are found at the end of (z, t, x2, and F tests for testing means, proportions, and variances) and (correlation, chi-square, and ANOVA) show students the different types of hypotheses and the types of tests to use. A Data Bank listing various attributes (educational level, cholesterol level, gender, etc.) for 100 people and several additional data sets using real data are included and referenced in various exercises and projects throughout the book. An updated reference card containing the formulas and the z, t, x2, and PPMC tables is included with this textbook. End-of-chapter Summaries, Important Terms, and Important Formulas give students a concise summary of the chapter topics and provide a good source for quiz or test preparation. Review Exercises are found at the end of each chapter. Special sections called Data Analysis require students to work with a data set to perform various statistical tests or procedures and then summarize the results. The data are included in the Data Bank in . Chapter Quizzes, found at the end of each chapter, include multiple-choice, true/false, and completion questions along with exercises to test students knowledge and comprehension of chapter content. The Appendices provide students with extensive reference tables, a glossary, and answers to all quiz questions and odd-numbered exercises. Additional Online Appendices include algebra review, an outline for report writing, Bayes theorem, and an alternative method for using the standard normal distribution. These can be found at www.mhhe.com/bluman. The Applying the Concepts feature is included in all sections and gives students an opportunity to think about the new concepts and apply them to examples and scenarios similar to those found in newspapers, magazines, and radio and television news programs.
|

x
Changes in the Eighth Edition | Global Changes Replaced over 70 examples with new ones and replaced approximately 400 new or revised exercises, many using real data. Updated Technology Tips sections.
|
Updated statistical examples to introduce how statistics are used in real life. |
|


