Depth of Market Trading Setups
The Latest in Futures Trading Tools
Guy Bower
Table of Contents
About the Book
So much of todays so called trader education material is trying to convince you all of this is easy, its not technical and anyone can do it.
That is complete BS and it explains why you dont see a lot of DOM education online. Its a harder sell than saying Look, here is a chart pattern. You can make lots of money from it. Just sign here .
I have to say I can get a bit frustrated when I see that kind of garbage. If you are going to trade short term, as in day trading, there are techniques you need to know. These are different from what you needed to know just 5-10 years ago.
If you dont know them, the guys that do will take your money away from you. Its as simple as that.
In this book, we look at DOM (or Depth, Market Depth, Depth of Market or just the ladder its all the same). Its a new style of trading and its more than just an order entry window. Its a way to read the current market.
Given a bit of time and practice you will start to wonder how on earth did we put up with it before this?.
This book is an introduction as well as a list of some suggested patterns you might see when trading DOM. The patterns are a place to start and aim to get you thinking about how to read DOM. They certainly will not complete you education here.
Trade hard!
Guy Bower
About TradingCourses.com
Built for traders by traders. TC is a site designed to educate and coach traders interested in a career in the markets or at the very least actively trading.
Short courses cover topics such as DOM trading, simulation exercises, productivity, spreading, STIR trading, technical analysis, understanding data and market psychology.
Special Offer for Readers:
Before we get started, follow the link below and well email out a few free courses plus a complete copy of Matt and Sari Kirks Bullseye: Top Trader Thinking a fantastic book of trader interviews and insight into what goes on between your ears.
http://domsetups.instapage.com/
Chapter 1: What is DOM?
Quite simply: its the layout we use to place orders in futures and equities. Thats it!
When thinking about teaching DOM, one quote has always come to mind. Its from The Matrix. Neo says why do my eyes hurt?. Morpheus responds Youve never used them before.
I love that quote! Its how you should be feeling when you first see DOM in action.
For you youngens out there, this is how we used to place orders:
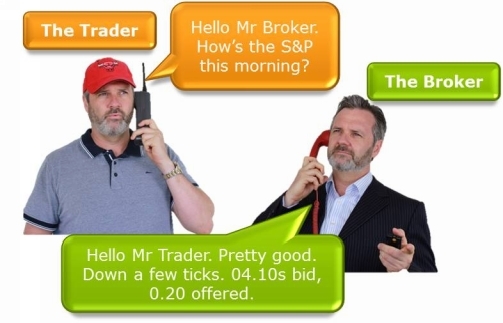
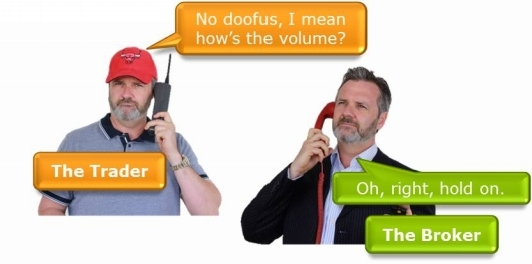


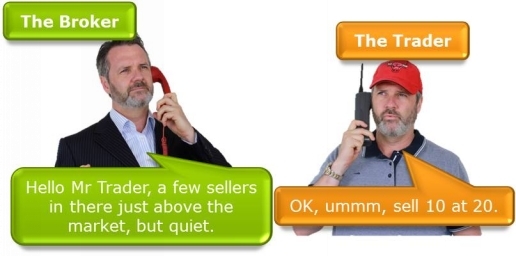

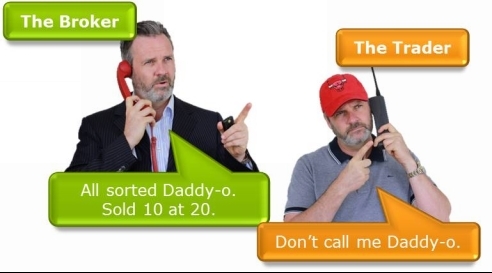
First of all, I hope you appreciate the costume changes just to snap those images and note the vintage phones. Thanks eBay! I was going to record it as a video, but realised Id missed a couple of extra people involved in the process and it all became too complicated. Still, it illustrates the point: the old way was long and cumbersome.
Hey, I remember back to my broking days (late 90s). We would each have two phones on our desks (yes, one for each ear) and occasionally have to grab a handset from the next guys desk if things got busy and we were spreading markets. We thought we were so efficient! Then came the internet.
Evolution
To be honest, Im not sure when electronic trading actually started. Id say it was the 70s, but that would be trading between dealer and dealer and generally in over-the-counter (OTC) products.
As far as mainstream electronic trading goes, for the private trader, availability grew along side growth in the internet and we really only saw decent trading platforms arrive in the 2000s. For the first ones were of course just offering bid and ask prices. Some then offered trading from a chart.
The introduction of depth however added a new level of ummmm depth to the picture. Depth shows not just the price of the bid and ask, but the volume being bid or offered there. It also shows the volume at the bid or on offer at nearby prices. Thats a massive amount of information that was not previously available.
A depth trading platform shows you this volume and allows you to place orders at those levels. It can show you:
- Where volume is high or low.
- Where there are big orders.
- Where they might be support or resistance
- Where one market is lagging a related market just by one or two ticks.
Its exciting stuff.
Todays Depth of Market
This is what it looks like:
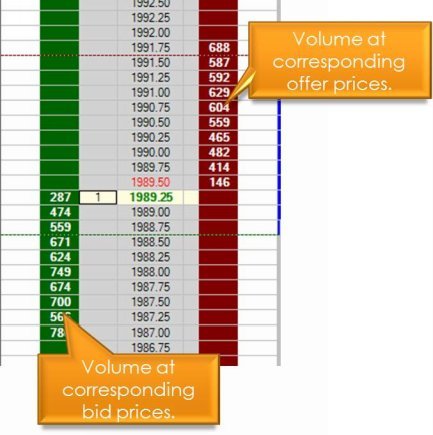
This is the emini S&P as shown on DT Pro. The centre column shows the price. The green shows the volume at the bid. The red shows the volume at the offer.
So for example at 1989.0, there are 474 contracts waiting to buy. The thing to note is there are not 474 buyers, there are 474 contracts. That might mean 20 or so buyers each with orders of around 20. It might mean more buyers or less buyers. We dont know that for sure. What we do know is the total volume to buy at that price is 474.
The thing to also note (well there are a lot of things), is these volumes change constantly as people and algos add and change orders. In a busy market, things move very quickly. Try calling up the DOM in the emini S&P or the Tnote just after the market opens or as employment data comes out.
More Details
Each platform is a little different and all have their bells and whistles. Some will show volume already traded alongside each price, a bit like Market Profile. They can also be set to light up or beep if certain volume trades, a price trades for the first time or a price trades at the bid or at the offer. Some will also show you where you are in the queue (very handy for our first exercise).
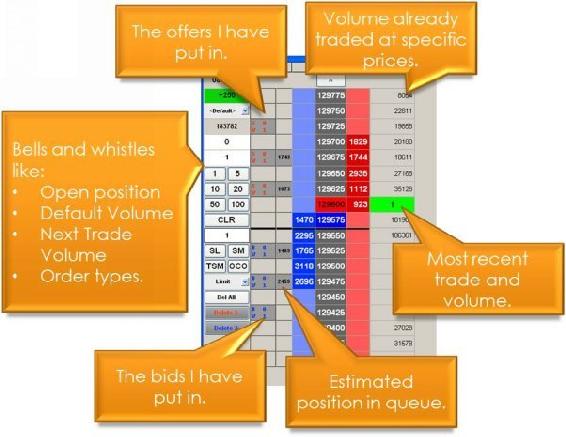
This picture is interesting. Its from TTs X_Trader a very good depth trading platform. Its the emini S&P, but taken a couple of years earlier. Look where its trading: 1294 then versus around 2000 now. Crazy!
As you can see from this pic, there are a lot of things you can add to the display. Whatever system you choose to use, have a play around with the settings and youll see for yourself.
How Deep is Your Depth?
Well, you may think this infringes on some Bee Gees copyright, but what I mean here is what you see on the depth display is what the exchange chooses to release and can vary from market to market. Most markets have 5 bid prices and 5 offer prices showing volume. Thats not to say there arent orders above or below those 5. These are simply not displaying at that moment. Most would argue 5 on each side (as shows above is enough. Other markets have 8 or 10. There is only one market I know of, cotton, that shows the depth all the way and up and wall the way down. Its more interesting than it is useful.
Next page
