Trading Tips - Big Book of Chart Patterns
Here you can read online Trading Tips - Big Book of Chart Patterns full text of the book (entire story) in english for free. Download pdf and epub, get meaning, cover and reviews about this ebook. year: 2019, publisher: Riddler, genre: Home and family. Description of the work, (preface) as well as reviews are available. Best literature library LitArk.com created for fans of good reading and offers a wide selection of genres:
Romance novel
Science fiction
Adventure
Detective
Science
History
Home and family
Prose
Art
Politics
Computer
Non-fiction
Religion
Business
Children
Humor
Choose a favorite category and find really read worthwhile books. Enjoy immersion in the world of imagination, feel the emotions of the characters or learn something new for yourself, make an fascinating discovery.

- Book:Big Book of Chart Patterns
- Author:
- Publisher:Riddler
- Genre:
- Year:2019
- Rating:3 / 5
- Favourites:Add to favourites
- Your mark:
Big Book of Chart Patterns: summary, description and annotation
We offer to read an annotation, description, summary or preface (depends on what the author of the book "Big Book of Chart Patterns" wrote himself). If you haven't found the necessary information about the book — write in the comments, we will try to find it.
Trading Tips: author's other books
Who wrote Big Book of Chart Patterns? Find out the surname, the name of the author of the book and a list of all author's works by series.


Big Book of Chart Patterns — read online for free the complete book (whole text) full work
Below is the text of the book, divided by pages. System saving the place of the last page read, allows you to conveniently read the book "Big Book of Chart Patterns" online for free, without having to search again every time where you left off. Put a bookmark, and you can go to the page where you finished reading at any time.
Font size:
Interval:
Bookmark:
| Big Book of Chart Patterns | |
| Trading Tips | |
| Riddler (Nov 2019) | |
| Tags: | Technical Analysis |
| Technical Analysisttt |
When most investors think of stock charts, they probably imagine a bunch of dots and lines
But what many of them DONT know is that those dots and lines often form extremely important patterns that signal HUGE moves in the prices of stocks.
In fact, Id say three out of four investors cant properly read charts.
But today, that all changes
After all, the minute a stock chart pattern becomes readily apparent
Its SO much easier to make huge sums of cash.
Thats why weve been burning the midnight oil in putting together the most comprehensive ebook on stock charting Ive ever seen.
And it contains some incredibly explosive information
- Which patterns are red-hot buy now indicators
- Which patterns show a stock is about to crash
- Which patterns have historically made people RICH
Thats just the tip of the iceberg, too.
We cover 50 total patterns - the most explosive patterns in the market patterns that could mean the difference between losing everything and earning a lasting legacy of wealth.
Big Book
of
Chart Patterns

Trading Tips
This book is
gifted to book-lovers by
Rddler & Cadzbuddy
The origins of chart patterns can be found in the work of Charles Dow in a series of articles published in his editorials for The Wall Street Journal from 1900-1902. His views were later developed into what is now known as Dow Theory. Dows observations of price trends and his understanding or trend based on the progression of peaks and troughs form the foundation for modern-day technical analysis.
The observations that Dow made, and the methodologies found in technical analysis are fractal in nature. This means that the techniques used can be applied to any aggregation period whether its intraday, daily, weekly or monthly.
As you study charts and look to identify patterns, youll want to spend time to identify the successive peaks and troughs or highs and lows. Also, as part of your pattern recognition it is important to be able to identify the previous trend based on the aggregation period being used. The combination of the previous trend and the current highs and lows will form the foundation for proper chart pattern recognition.
This resource is intended to introduce you to 50 different price patterns. With every price pattern there is a setup, a trigger and a projected move. For each pattern, there is a description of whether the pattern is bullish, bearish or non-directional. Whether its a signal of a continuation of the trend, a reversal of the trend, or is non-directional. Also, there is a description of how volume develops during the formation of the pattern, and how to establish a price projection based on the measuring technique for each pattern.
Statistical references in this book is taken from the Encyclopedia of Chart Patterns by Thomas Bulkowski. His work represents the most comprehensive study of the effectiveness of chart patterns to date.
CHART PATTERNS

Directional Bias: Bullish
Pattern Type: Reversal
Pattern Description: This pattern forms at the tail end of a downtrend. The pattern takes on the appearance of a megaphone as the price forms a series of higher highs and lower lows throughout the formation. The pattern needs at least two highs and lows to be a valid formation.
Volume Description: The volume should diminish through the pattern up until the breakout
Breakout Confirmation: A close above the upper trend-line on above average volume.
Measuring Technique: Measure from the highest high to the lowest low before the breakout, and add that amount to the highest high for the price target.
Amount to the highest high for the price target.
Year lows tend to perform better.

Directional Bias: Bearish
Pattern Type: Reversal
Pattern Description: This pattern forms at the tail end of an uptrend. The pattern takes on the appearance of a megaphone as the price forms a series of higher highs and lower lows throughout the formation. The pattern needs at least two highs and lows to be a valid formation.
Volume Description: The volume should diminish through the pattern up until the breakout
Breakout Confirmation: A close below the lower trend-line on above average volume.
Measuring Technique: Measure from the highest high to the lowest low before the breakout and subtract that amount from the lowest low for the price target.
That amount from the lowest low for the price target.
Year highs tend to perform better.
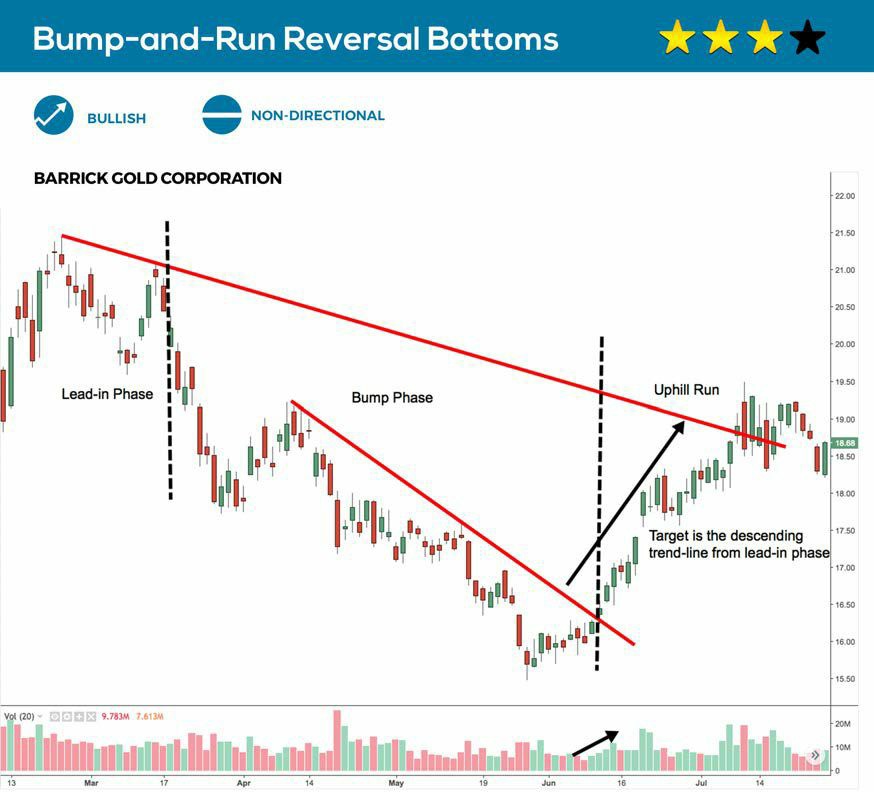
Directional Bias: Bullish
Pattern Type: Non-Directional
Pattern Description: This pattern is comprised of three phases and looks similar to a frying pan. There is the lead-in phase, the bump phase and the uphill run. The lead-in phase is the handle of the frying pan before a larger decline. Following the decline, the bump phase forms as the price forms a flat or rounded bottom. The uphill run phase is after the breakout. For this type of formation to be analyzed an arithmetic chart will need to be used.
Volume Description: Volume is typically high at the beginning of each phase and decreases throughout each phase.
Breakout Confirmation: A close above the upper trend-line drawn across the highs, during the lead-in phase, with above average volume.
Measuring Technique: The price target is the highest point of the lead-in phase.
Statistical Notes: Wider formations tend to perform better than narrower formations, and a throwback

Directional Bias: Bearish
Pattern Type: Non-Directional
Pattern Description: This pattern is comprised of three phases and looks similar to a mountain range. There is the lead-in phase, the bump phase and the downhill run. The lead-in phase is like a small range of foothills before the larger mountains. Following an advance, the bump phase forms as the price forms a flat or rounded top. The downhill run phase is after the breakout. For this type of formation to be analyzed an arithmetic chart will need to be used.
Volume Description: Volume is typically high at the beginning of each phase and decreases throughout each phase.
Breakout Confirmation: A close below the lower trend-line drawn across the lows, during the lead-in phase, with above average volume.
Measuring Technique: The price target is the lowest point of the lead-in phase.
Statistical Notes: Wider formations tend to perform better than narrower formations, and a pullback

Font size:
Interval:
Bookmark:
Similar books «Big Book of Chart Patterns»
Look at similar books to Big Book of Chart Patterns. We have selected literature similar in name and meaning in the hope of providing readers with more options to find new, interesting, not yet read works.
Discussion, reviews of the book Big Book of Chart Patterns and just readers' own opinions. Leave your comments, write what you think about the work, its meaning or the main characters. Specify what exactly you liked and what you didn't like, and why you think so.