• Complain

Jasmeen Kaur - Data Analysis & Dashboarding with Microsoft Excel

Here you can read online Jasmeen Kaur - Data Analysis & Dashboarding with Microsoft Excel full text of the book (entire story) in english for free. Download pdf and epub, get meaning, cover and reviews about this ebook. year: 2022, genre: Home and family. Description of the work, (preface) as well as reviews are available. Best literature library LitArk.com created for fans of good reading and offers a wide selection of genres:

Romance novel Science fiction Adventure Detective Science History Home and family Prose Art Politics Computer Non-fiction Religion Business Children Humor

Choose a favorite category and find really read worthwhile books. Enjoy immersion in the world of imagination, feel the emotions of the characters or learn something new for yourself, make an fascinating discovery.

No cover
  • Book:
    Data Analysis & Dashboarding with Microsoft Excel
  • Author:
  • Genre:
  • Year:
    2022
  • Rating:
    5 / 5
  • Favourites:
    Add to favourites
  • Your mark:
    • 100
    • 1
    • 2
    • 3
    • 4
    • 5

Data Analysis & Dashboarding with Microsoft Excel: summary, description and annotation

We offer to read an annotation, description, summary or preface (depends on what the author of the book "Data Analysis & Dashboarding with Microsoft Excel" wrote himself). If you haven't found the necessary information about the book — write in the comments, we will try to find it.

With the world brimming with data, data analysis is one of the most in-demand digital skills today. Microsoft Excel remains the most popular number-crunching tool across all businesses of any size and type. This book will teach you a highly desirable combination of data analysis with Excel skills by walking you through the data analytics lifecycle. You will download practice spreadsheets and follow step-by-step instructions to learn powerful Excel features relevant to data analysis, including
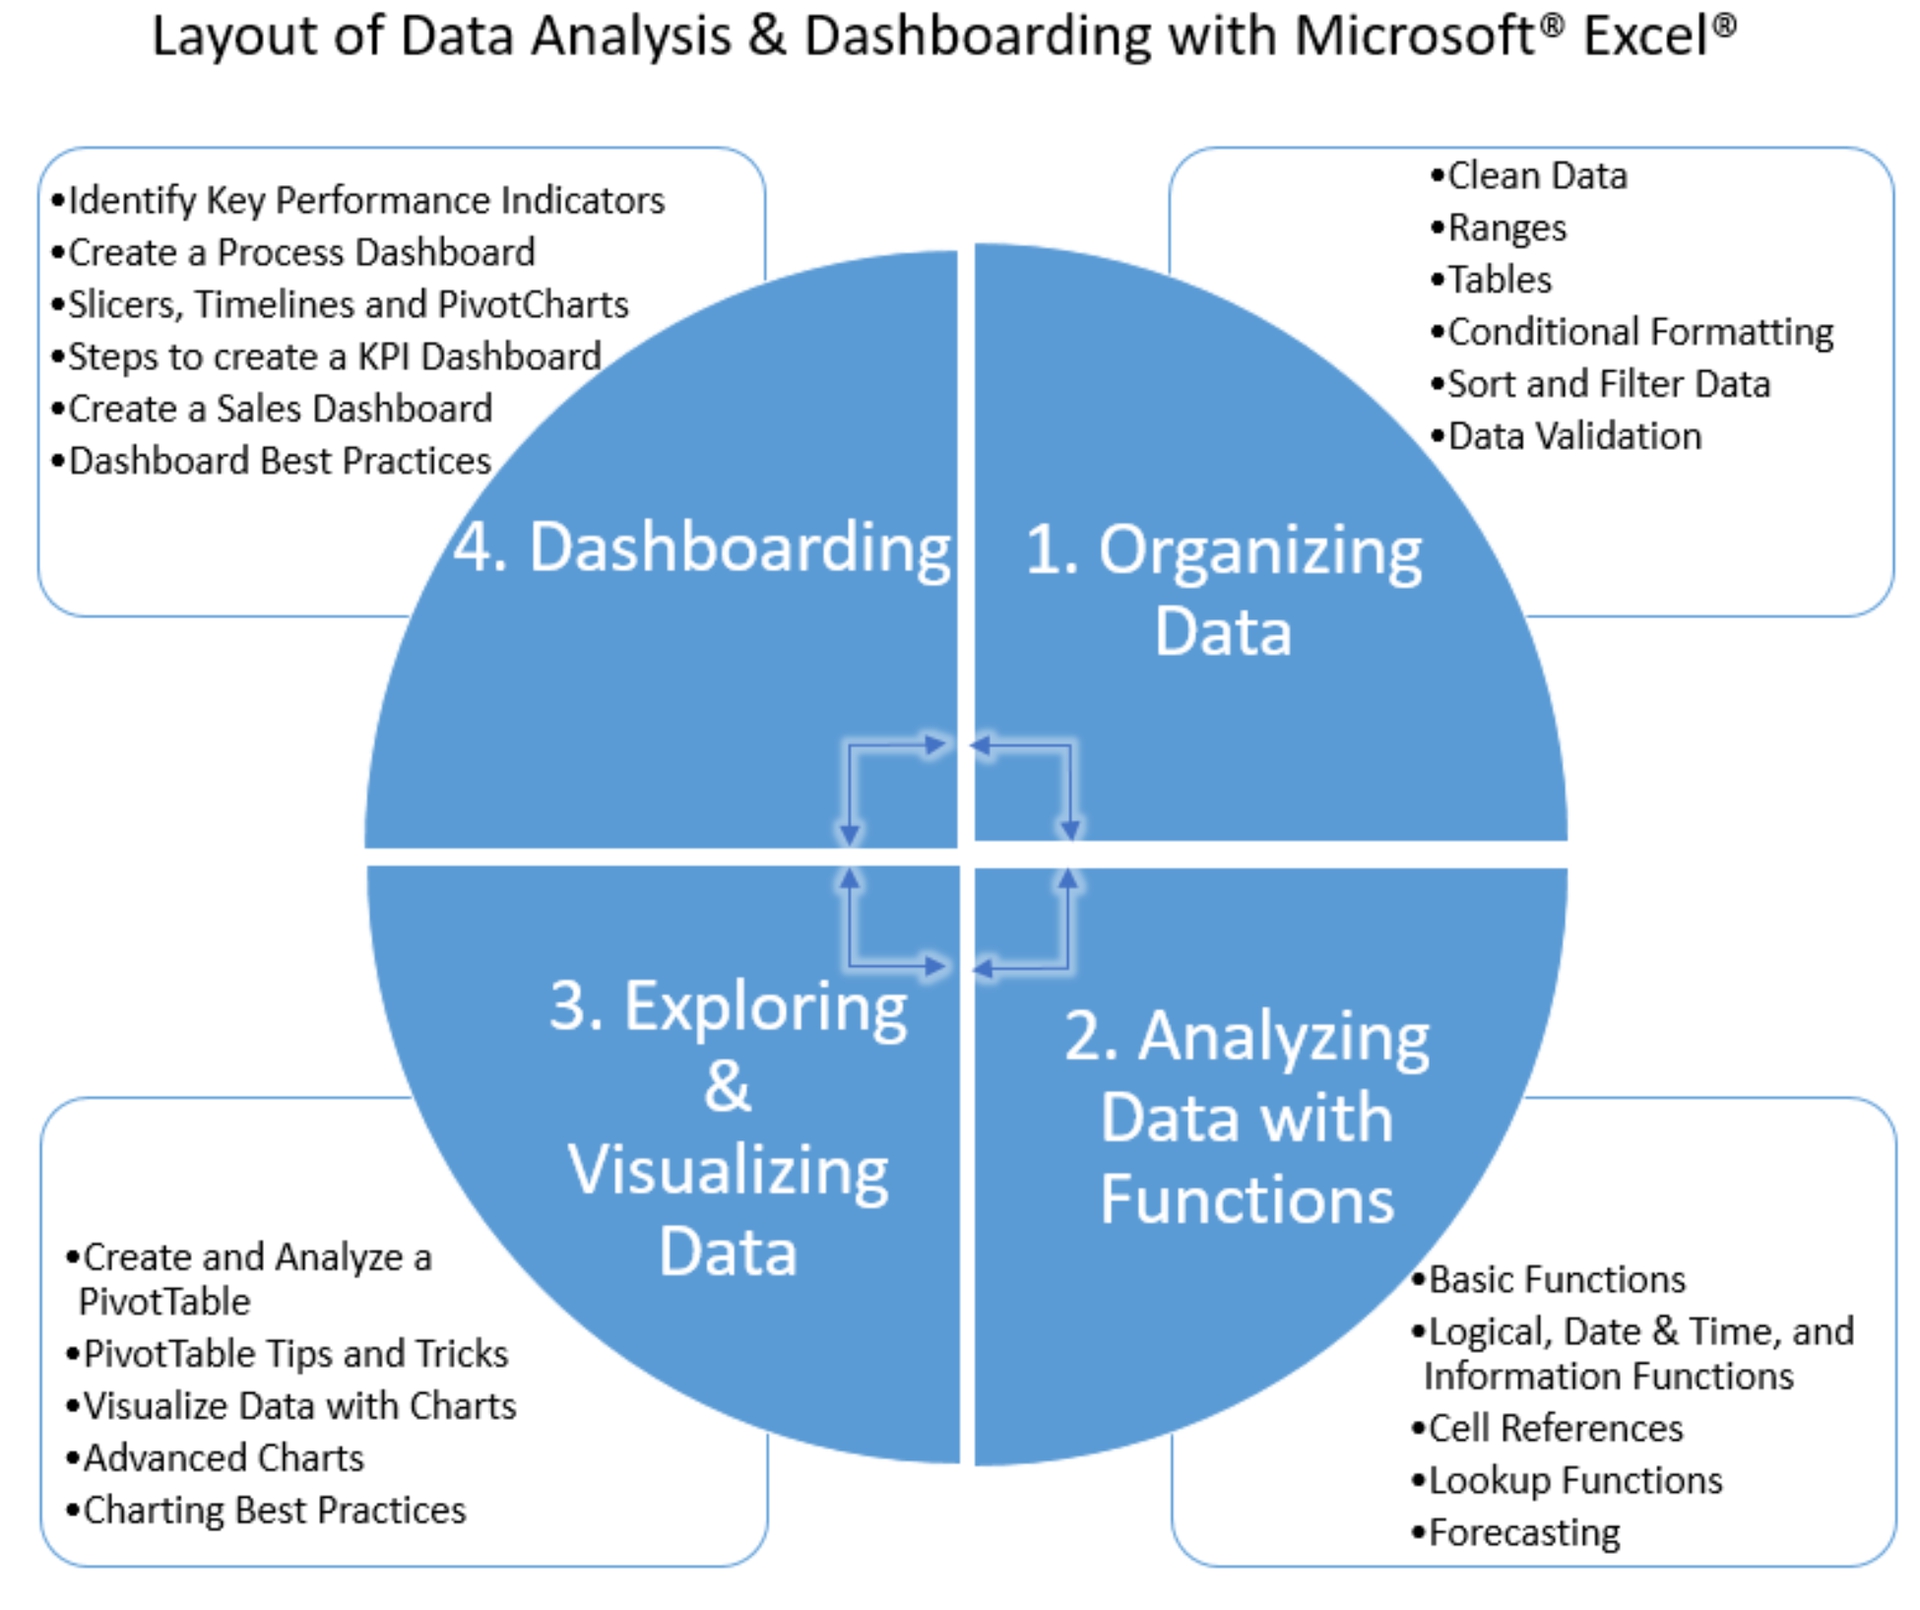
  • Cleaning and organizing data,
  • Analyzing data with basic and advanced functions,
  • Exploring aggregated data interactively with PivotTables and PivotCharts,
  • Visualizing data with charts, and
  • Creating professional and interactive dashboards.
The book is designed in a way that previously covered features are recalled in future chapters to ensure you solidify your understanding of how those features tie together as building blocks of the data analytics lifecycle. You will also develop a couple of cool dashboards from scratch!
About the Author
Jasmeen Kaur is an experienced business intelligence professional passionate about supporting managements decision-making with quantitative evidence. She has worked with data for over eight years and is keen on sharing her knowledge of the most business-relevant Excel features with her readers. She has a masters degree from McGill University, Canada and currently works in the public service.

Jasmeen Kaur: author's other books


Who wrote Data Analysis & Dashboarding with Microsoft Excel? Find out the surname, the name of the author of the book and a list of all author's works by series.

Data Analysis & Dashboarding with Microsoft Excel — read online for free the complete book (whole text) full work

Below is the text of the book, divided by pages. System saving the place of the last page read, allows you to conveniently read the book "Data Analysis & Dashboarding with Microsoft Excel" online for free, without having to search again every time where you left off. Put a bookmark, and you can go to the page where you finished reading at any time.

Light

Font size:

Reset

Interval:

Bookmark:

Make
Data Analysis & Dashboarding with Microsoft Excel
Copyright 2022 Jasmeen Kaur
All rights reserved.
Contents
Introduction
Data analysis is one of the most in-demand digital skills today. It helps companies rationally assess situations and make evidence-based business decisions. Microsoft Excel is the most popular data analysis tool used in business with estimates suggesting 750 million active Excel users. All business firms irrespective of their size and services use Excel to conduct diverse functions with 80-90% of the firms using spreadsheets for financial reporting and forecasting. According to a study conducted by Burning Glass Technologies and Capital One in 2017, more than 8 in 10 middle-skill jobs (82%) now require Excel skills. When interviewed, the salaries of those with analytical skills are 13-38% higher. Hence, a highly desirable combination of data analysis and Excel skills can help send the resume of a new job seeker to the top and can place middle-skilled workers in a highly favored position for future leadership.
This book aims to unlock the power of data using the data cleaning, analysis, visualization and dashboarding features available in Excel. The focus will be on walking the audience through the most powerful Excel features relevant to business data analysis.
The book will walk you through the complete lifecycle of data analysis using Excel, including cleaning data, analyzing and aggregating data, exploring aggregated data interactively, and visualizing and reporting key information and business insights to the management with professional and interactive dashboards. Practice workbooks will be available to download along with the book to help you follow the step-by-step instructions and snapshots to practice your newly acquired skills for data analysis and dashboarding in Excel. The snapshots are based on Microsoft Excel 2016 although they should work with Excel 2013, Excel 2019 or even Excel 365.
The research has shown that only studying individual Excel features in isolation results in amateur Excel users who understand features but not how they fit together. Instead of teaching Excel as a point-and-click tool, the book is designed in a way that previously covered features get recalled to ensure you solidify your understanding of how those features tie together as building blocks in the data analytics lifecycle. Towards the end, you will even develop a couple of cool interactive Excel dashboards from scratch!
Target Audience
The book is intended for:
  • Anyone looking to pursue a career in data analysis and reporting
  • Students and young adults who want to learn a skill set that is useful for any role in any industry
  • Business professionals who know Excel but arent confident about turning data into business insights
Although it is recommended that the audience has rudimentary functional knowledge of Excel, this book is also suitable for a beginner with basic computer skills. The book consists of four lessons providing you with solid theoretical understanding as well as the considerable practice of the data analysis tools and features in Excel.
Data Analytics Lifecycle
Microsoft Excel can be used to perform various data analysis functions, including data collection, structuring, aggregation, exploration, visualization and dashboarding. These capabilities of Excel can be employed to perform ad hoc as well as regular analysis and reporting. To get started with any analysis, collecting data relevant to the business problem or question and organizing it into a structure and format that makes analysis easy and efficient is paramount. While data collection refers to collecting and extracting data from several internal and external sources, including databases, spreadsheets, websites, etc., organizing data involves cleaning data to remove irrelevant information and arranging data in a structure that enables filtering and sorting of the data. Once the data is organized, there are a variety of Excel tools that may be utilized to analyze it. The choice of an ideal method or a combination of methods depends on the nature and complexity of the business requirements. One such method involves analyzing data with functions . Excel has some key simple and advanced functions that handle the majority of your Excel data analysis tasks. If the purpose is aggregating and exploring data , Excel PivotTables provide a fast, interactive and intuitive solution. They allow you to quickly explore and analyze raw data in Excel revealing powerful insights and trends. Visualizing data with Excel charts includes examining data in graphical format and obtaining additional insights regarding the trends within the data. Reporting data involves sharing the results of the data analysis in a format as required by the users to support their decision-making and further action via static reports or dynamic dashboards. Both utilize data visualization techniques, such as tables and charts which help in communicating the message clearly and efficiently to the users, however, dashboards are more interactive and drillable than static reports.
Data analysis is a cyclical and iterative process. Based on the trends you observe while visualizing data, you might need to go back to analyzing and aggregating it a bit differently. Based on the feedback by the users, you might even need to collect more data. Any of the steps will need to be reiterated to meet new needs.
Layout of the book
The book contains four lessons with each of the lessons comprising of several chapters. Before we dive in, below is a brief description of each of the lessons:
Lesson 1 The lesson kicks off our journey through the data analytics lifecycle - photo 1
Lesson 1
The lesson kicks off our journey through the data analytics lifecycle with steps to clean data. You will then learn about various Excel tools available to organize data in a format that makes data analysis easy. Topics to be covered include:
  • Study a variety of functions to clean and format various fields within the data
  • Create, use and manage named ranges to enhance analysis
  • Create, use and manage and named tables to organize data
  • Use conditional formatting to format and analyze data based on conditions
  • Sort and filter data to retrieve the data you need
  • Apply data validation for error-free data collection
Lesson 2
Excel has a large variety of functions. This lesson explores a set of functions most relevant to data analysis. Starting with basic functions SUM, SUMIF, AVERAGE, AVERAGEIF, etc. critical to using Excel for data analysis, the course will move on to advanced functions VLOOKUP, HLOOKUP, INDEX & MATCH used to obtain information from different parts of a workbook. You will also be introduced to cell references used to input functions and create excel formulae. A detailed study of logical, information, and data & time functions to help extract information and manipulate data to fulfill specific business requirements will follow. Toward the end of this lesson, we will also cover forecasting, a technique used to determine future trends based on historical data.
Lesson 3
This lesson starts with exploring PivotTables that are unarguably the quickest data summarization and aggregation tool. You will learn to create and modify PivotTables to answer a variety of business questions. Then, tips and tricks to optimize the use of PivotTables will be discussed.
Moving on, the lesson will cover how to create and modify charts in Excel. Charts are one of the most common ways to present data visually. Starting with common chart types - line, bar, pie charts, etc., we will then explore a few advanced charting techniques available in Excel. You will get to understand various charts and will build them on your own. We will wrap up with charting best practices to help design effective charts.
Next page
Light

Font size:

Reset

Interval:

Bookmark:

Make

Similar books «Data Analysis & Dashboarding with Microsoft Excel»

Look at similar books to Data Analysis & Dashboarding with Microsoft Excel. We have selected literature similar in name and meaning in the hope of providing readers with more options to find new, interesting, not yet read works.


Reviews about «Data Analysis & Dashboarding with Microsoft Excel»

Discussion, reviews of the book Data Analysis & Dashboarding with Microsoft Excel and just readers' own opinions. Leave your comments, write what you think about the work, its meaning or the main characters. Specify what exactly you liked and what you didn't like, and why you think so.