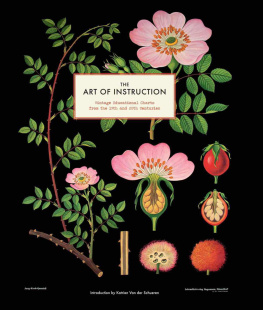
THE ART OF INSTRUCTION:
Vintage Educational Charts from the 19th and 20th Centuries
Introduction by Katrien Van der Schueren

Introduction and compilation copyright 2011 by
Katrien Van der Schueren.
All rights reserved. No part of this book may be reproduced
in any form without written permission from the publisher.
constitutes as a continuation of the copyright page.
The Library of Congress has cataloguing data available.
ISBN: 978-1-4521-2851-1
Design by Sara Schneider
Chronicle Books LLC
680 Second Street
San Francisco, CA 94107
www.chroniclebooks.com
Contents
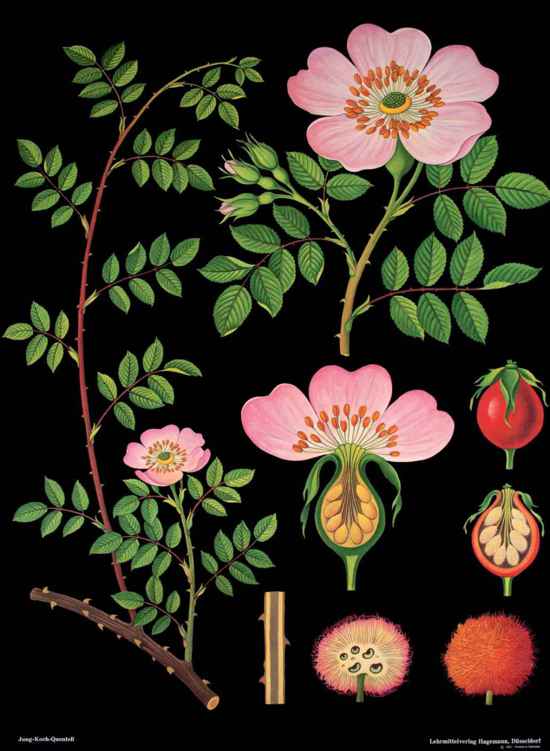
plate 1 Dog Rose
Introduction:
There are objects from the past that can tell a story greater than what they were originally designed to do. One such relic is the illustrated wall chart from the late 1800s and 1900s, which was created as a practical classroom aid and is now treasured for its artistic merit. Profoundly elegant and beautiful, these charts are a window into the intersecting histories of education, science, and art.
The first educational wall charts were likely printed in Germany around 1820, when compulsory schooling began to spread throughout Europe and classroom size increased. The continent was facing the Industrial Revolution, rapid population growth, and a new perspective on education: learning as a fundamental human right. Governments saw it as their duty to mandate schooling, and this shift created a sustained and thriving market for the illustrated charts. Early visually aided instruction methods, such as passing around loose engravings or picture books, became inadequate. Giant-size images visible from anywhere within a crowded classroom offered an ideal solution.
With the invention of lithography in 1798, printers were able to produce large-scale images at an affordable price. Soon after, further technological innovations introduced chromolithography and enabled industrial-scale mass reproduction. As production speed, printing quality, color range, and price points improved, the pictorial charts gained in popularity. First introduced at the primary-school level, they quickly became the didactic aid par excellence for teaching a variety of subjectsbotany, human anatomy, zoology, and ecology among themat all grade levels.
Wall charts were regularly advertised by printers in magazines for educators. As a large-scale (roughly 35 50 inches each), easy-to-store, and affordable medium, they were welcomed with rave reviews by the scholastic community. Governments began to recognize the charts value in the classroom, and in many instances either subsidized production or wholly financed their acquisition for schools. The industry quickly became an intensive trade across Europe, with Germany as the market leader. At the peak of their popularity, roughly between 1870 and 1920, wall charts were translated into several languages and sold and distributed throughout the world, often with accompanying textbooks.
The size, vibrant color, and rich detail of these illustrated charts not only made them an ideal medium for teaching classifications in nearly all branches of biology, but these characteristics also lent them an aesthetic quality. The charts served a dual role, as both scientific tools and works of art. Responsible for the investigation of classroom decor and imagery, French commissioner Charles Bigot reported in the 1880s:
It is not enough to teach design in schools: we must still make the school itself a museum, a kind of sanctuary where there is beauty as well as science and virtue. Let the child live, surrounded by noble works that constantly speak to him, arousing his curiosity, raise his soul.... Art must come to him from almost all sides as the air he breathes.
When charts on specific subjects were lacking, or when charts in general werent readily available, some schoolteachers would create their own hand-drawn versions. University professors and eminent scientists would also make their own wall charts to illustrate their scholarly discoveries, working closely with artists who specialized in scientific illustration. In the case of natural history charts, the images had to be as true to nature as possible, so its no surprise that artists who worked on the most famous scientific series all had a strong background in studying and imitating nature.
Painter Gottlieb von Koch (18491914), for example, whose images are amply featured in this book (Plates 139, 7283, 8589, and 91117), had an extensive knowledge of natural history. As an assistant to renowned biologist and artist Ernst Haeckel (18341919), von Koch worked on many scientific studies before he himself became a professor in biology at a university in Darmstadt, Germany. Together with college director Dr. Friedrich Quentell and the teacher Heinrich Jung, von Koch created an extensive series of zoology and botany charts.
First published by Frommann & Morian in Darmstadt in 1894, the Jung-Koch-Quentell charts were an immediate success internationally and were praised not only for their scientific accuracy and visibility but also for their beauty. Their stylistic approach reflects the didactic thinking of the late nineteenth century perfectly. They were specifically designed so that they could be viewed by all pupils, even those in the last row. These striking images on black backgrounds had to grab the students attention and entice their curiosity. Purposefully void of text, the charts were designed to enhance classroom participation. An accompanying textbook provided teachers with keys to the charts, many of which are reproduced in this book (see Appendix).
As scientific tools, the Jung-Koch-Quentell charts met the educational priorities of the day, and were perfectly in line with the empirical teaching methods and theories at work during this period. Rather than define a species solely by its anatomical structure, their detailed drawings took a more comprehensive approach to describing a speciesoften including illustrations of its typical behavior, habitat, or close evolutionary relatives. The main field of the chart Domestic Fowl () gives details on how birds fly.
After World War II, Frommann & Morian went out of business. Wilhelm and Maria Hagemann, founders and owners of Wilhelm Hagemann Education Media in Dsseldorf, bought the rights of publication to these charts in the 1950s and took up the task of updating a considerable selection of titles in the botany and zoology series. While remaining faithful to the Jung-Koch-Quentell style, Hagemann edited the original charts to reflect the new scientific discoveries of the mid-twentieth century. To this day, Hagemann still prints these edited charts using the original lithographic process, in up to ten colors. Plates 34, 78, 88, and 92 showcase some of the rare original nineteenth-century Jung-Koch-Quentell prints, which have never been reprinted. Along with these originals, this book also features nearly all of the re-edited Hagemann selections from the 1950s and 60s. They are not only some of the most well-known examples of the medium, but with a life cycle that spans more than a century, they are a unique and important addition to the collection in this book.
Some of the earliest charts featured in these pages are rare Danish examples (Plates 5663). Produced under the supervision of the famed Danish botanist and pioneer in ecology, Dr. Eugen Warming (18411924), these charts were typically used at the university level. Plates 4055, on the other hand, showcase a selection of the more common French charts from the printer Les ditions Rossignol. Founded in 1946, Les ditions Rossignol rapidly grew into one of the most well-known European publishers of primary-school-level charts throughout France and Belgium.

