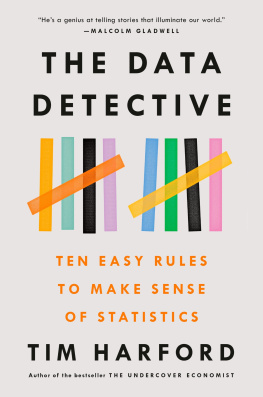
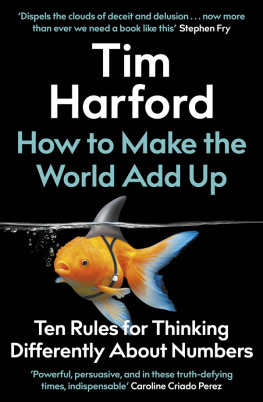
Tim Harford - The Data Detective: Ten Easy Rules to Make Sense of Statistics
Here you can read online Tim Harford - The Data Detective: Ten Easy Rules to Make Sense of Statistics full text of the book (entire story) in english for free. Download pdf and epub, get meaning, cover and reviews about this ebook. year: 2021, publisher: Penguin Publishing Group, genre: Politics. Description of the work, (preface) as well as reviews are available. Best literature library LitArk.com created for fans of good reading and offers a wide selection of genres:
Romance novel
Science fiction
Adventure
Detective
Science
History
Home and family
Prose
Art
Politics
Computer
Non-fiction
Religion
Business
Children
Humor
Choose a favorite category and find really read worthwhile books. Enjoy immersion in the world of imagination, feel the emotions of the characters or learn something new for yourself, make an fascinating discovery.
- Book:The Data Detective: Ten Easy Rules to Make Sense of Statistics
- Author:
- Publisher:Penguin Publishing Group
- Genre:
- Year:2021
- Rating:4 / 5
- Favourites:Add to favourites
- Your mark:
- 80
- 1
- 2
- 3
- 4
- 5
The Data Detective: Ten Easy Rules to Make Sense of Statistics: summary, description and annotation
We offer to read an annotation, description, summary or preface (depends on what the author of the book "The Data Detective: Ten Easy Rules to Make Sense of Statistics" wrote himself). If you haven't found the necessary information about the book — write in the comments, we will try to find it.
The Data Detective: Ten Easy Rules to Make Sense of Statistics — read online for free the complete book (whole text) full work
Below is the text of the book, divided by pages. System saving the place of the last page read, allows you to conveniently read the book "The Data Detective: Ten Easy Rules to Make Sense of Statistics" online for free, without having to search again every time where you left off. Put a bookmark, and you can go to the page where you finished reading at any time.
Font size:
Interval:
Bookmark:
The Undercover Economist
The Logic of Life: The Rational Economics of an Irrational World
Dear Undercover Economist
Adapt: Why Success Always Starts with Failure
The Undercover Economist Strikes Back
Messy: The Power of Disorder to Transform Our Lives
Fifty Inventions That Shaped the Modern Economy

RIVERHEAD BOOKS
An imprint of Penguin Random House LLC
penguinrandomhouse.com

First published in Great Britain as How to Make the World Add Up: Ten Rules for Thinking Differently About Numbers by The Bridge Street Press, an imprint of Little, Brown Book Group, a division of Hachette UK Limited, London, in 2020.
First American edition published by Riverhead, 2021.
Copyright 2020 by Tim Harford
Penguin supports copyright. Copyright fuels creativity, encourages diverse voices, promotes free speech, and creates a vibrant culture. Thank you for buying an authorized edition of this book and for complying with copyright laws by not reproducing, scanning, or distributing any part of it in any form without permission. You are supporting writers and allowing Penguin to continue to publish books for every reader.
Grateful acknowledgment is made for permission to reprint the following images: : Hugh Small
Riverhead and the R colophon are registered trademarks of Penguin Random House LLC.
Library of Congress Cataloging-in-Publication Data
Names: Harford, Tim, 1973 author.
Title: The data detective : ten easy rules to make sense of statistics / Tim Harford.
Description: New York : Riverhead Books, 2021. | Includes bibliographical references and index.
Identifiers: LCCN 2020024095 | ISBN 9780593084595 (hardcover) | ISBN 9780593084670 (ebook)
Subjects: LCSH: StatisticsMethodology. | Social sciencesStatistical methods.
Classification: LCC HA29 .H2498 2021 | DDC 001.4/22dc23
LC record available at https://lccn.loc.gov/2020024095
Cover design: Grace Han
pid_prh_5.6.1_c0_r0
CONTENTS


The truly genuine problem... does not consist of proving something false but in proving that the authentic object is authentic.
Umberto Eco
You know the old story about storks delivering babies? Its true. I can prove it with statistics. Take a look at the estimated population of storks in each country, and then at the number of babies born each year. Across Europe, theres a remarkably strong relationship. More storks, more babies; fewer storks, fewer babies.
The pattern is easily strong enough to pass a traditional hurdle for publication in an academic journal. In fact, a scientific paper has been published with the title Storks Deliver Babies (p = 0.008). Without getting too technical, all those zeros tell us that this is not a coincidence.
Perhaps you have already guessed the trick. Large European countries such as Germany, Poland, and Turkey are home to many babies and many storks. Small countries such as Albania and Denmark have few babies and few storks. While theres a clear pattern in the data, that pattern does not mean that storks cause babies to appear.
You can prove anything with statistics, it seemseven that storks deliver babies.
Youd certainly have gotten that impression from reading How to Lie with Statistics. Published in 1954 by a little-known American freelance journalist named Darrell Huff, this wisecracking, cynical little book immediately received a rave review from the New York Times and went on to become perhaps the most popular book on statistics ever published, selling well over a million copies.
The book deserves the popularity and the praise. Its a marvel of statistical communication. It also made Darrell Huff a nerd legend. Ben Goldacre, an epidemiologist and bestselling author of Bad Science, has written admiringly of how The Huff had written a ripper. The American writer Charles Wheelan describes his book Naked Statistics as an homage to Huffs classic. The respected journal Statistical Science organized a Huff retrospective fifty years after its publication.
I used to feel the same way. As a teenager, I loved reading How to Lie with Statistics. Bright, sharp, and illustrated throughout with playful cartoons, the book gave me a peek behind the curtain of statistical manipulation, showing me how the swindling was done so that I would not be fooled again.
Huff is full of examples. He begins by pondering how much money Yale graduates make. According to a 1950 survey, the class of 1924 had an average income of close to $500,000 a year in todays terms. That is just plausible enough to believethis is Yale, after allbut half a million dollars a year is a lot of money. Is that really the average?
No. Huff explains that this improbably salubrious figure comes from self-reported data, which means we can expect people to exaggerate their income for the sake of vanity. Furthermore, the survey is only of people who bothered to respondand only those alumni Yale could find. And who are easily found? The rich and famous. Who are the little lost sheep down in the Yale rolls as address unknown? asks Huff. Yale will keep track of the millionaire alumni, but some of the also-ran graduates might easily have slipped through the net. All this means that the survey will present a grossly inflated view.
Huff briskly moves on through a vast range of statistical crimes, from toothpaste advertisements based on cherry-picked research to maps that change their meaning depending on how you color them in. As Huff wrote, The crooks already know these tricks; honest men must learn them in self-defense.
If you read How to Lie with Statistics, you will come away more skeptical about the ways numbers can deceive you. Its a clever and instructive book.
But Ive spent more than a decade trying to communicate statistical ideas and fact-check numerical claimsand over the years, Ive become more and more uneasy about How to Lie with Statistics and what that little book represents. What does it say about statisticsand about usthat the most successful book on the subject is, from cover to cover, a warning about misinformation?
Darrell Huff published How to Lie with Statistics in 1954. But something else happened that very same year: two British researchers, Richard Doll and Austin Bradford Hill, produced one of the first convincing studies to demonstrate that smoking cigarettes causes lung cancer.
Doll and Hill could not have figured this out without statistics. Lung cancer rates had increased sixfold in the UK in just fifteen years; by 1950 the UK had the highest in the world, and deaths from lung cancer exceeded deaths from tuberculosis for the first time. Even to realize that this was happening required a statistical perspective. No single doctor would have formed more than an anecdotal impression.
Font size:
Interval:
Bookmark:
Similar books «The Data Detective: Ten Easy Rules to Make Sense of Statistics»
Look at similar books to The Data Detective: Ten Easy Rules to Make Sense of Statistics. We have selected literature similar in name and meaning in the hope of providing readers with more options to find new, interesting, not yet read works.
Discussion, reviews of the book The Data Detective: Ten Easy Rules to Make Sense of Statistics and just readers' own opinions. Leave your comments, write what you think about the work, its meaning or the main characters. Specify what exactly you liked and what you didn't like, and why you think so.

