Paul Krugman - Macroeconomics
Here you can read online Paul Krugman - Macroeconomics full text of the book (entire story) in english for free. Download pdf and epub, get meaning, cover and reviews about this ebook. year: 2021, publisher: Macmillan Higher Education, genre: Politics. Description of the work, (preface) as well as reviews are available. Best literature library LitArk.com created for fans of good reading and offers a wide selection of genres:
Romance novel
Science fiction
Adventure
Detective
Science
History
Home and family
Prose
Art
Politics
Computer
Non-fiction
Religion
Business
Children
Humor
Choose a favorite category and find really read worthwhile books. Enjoy immersion in the world of imagination, feel the emotions of the characters or learn something new for yourself, make an fascinating discovery.

- Book:Macroeconomics
- Author:
- Publisher:Macmillan Higher Education
- Genre:
- Year:2021
- Rating:4 / 5
- Favourites:Add to favourites
- Your mark:
- 80
- 1
- 2
- 3
- 4
- 5
Macroeconomics: summary, description and annotation
We offer to read an annotation, description, summary or preface (depends on what the author of the book "Macroeconomics" wrote himself). If you haven't found the necessary information about the book — write in the comments, we will try to find it.
Macroeconomics — read online for free the complete book (whole text) full work
Below is the text of the book, divided by pages. System saving the place of the last page read, allows you to conveniently read the book "Macroeconomics" online for free, without having to search again every time where you left off. Put a bookmark, and you can go to the page where you finished reading at any time.
Font size:
Interval:
Bookmark:
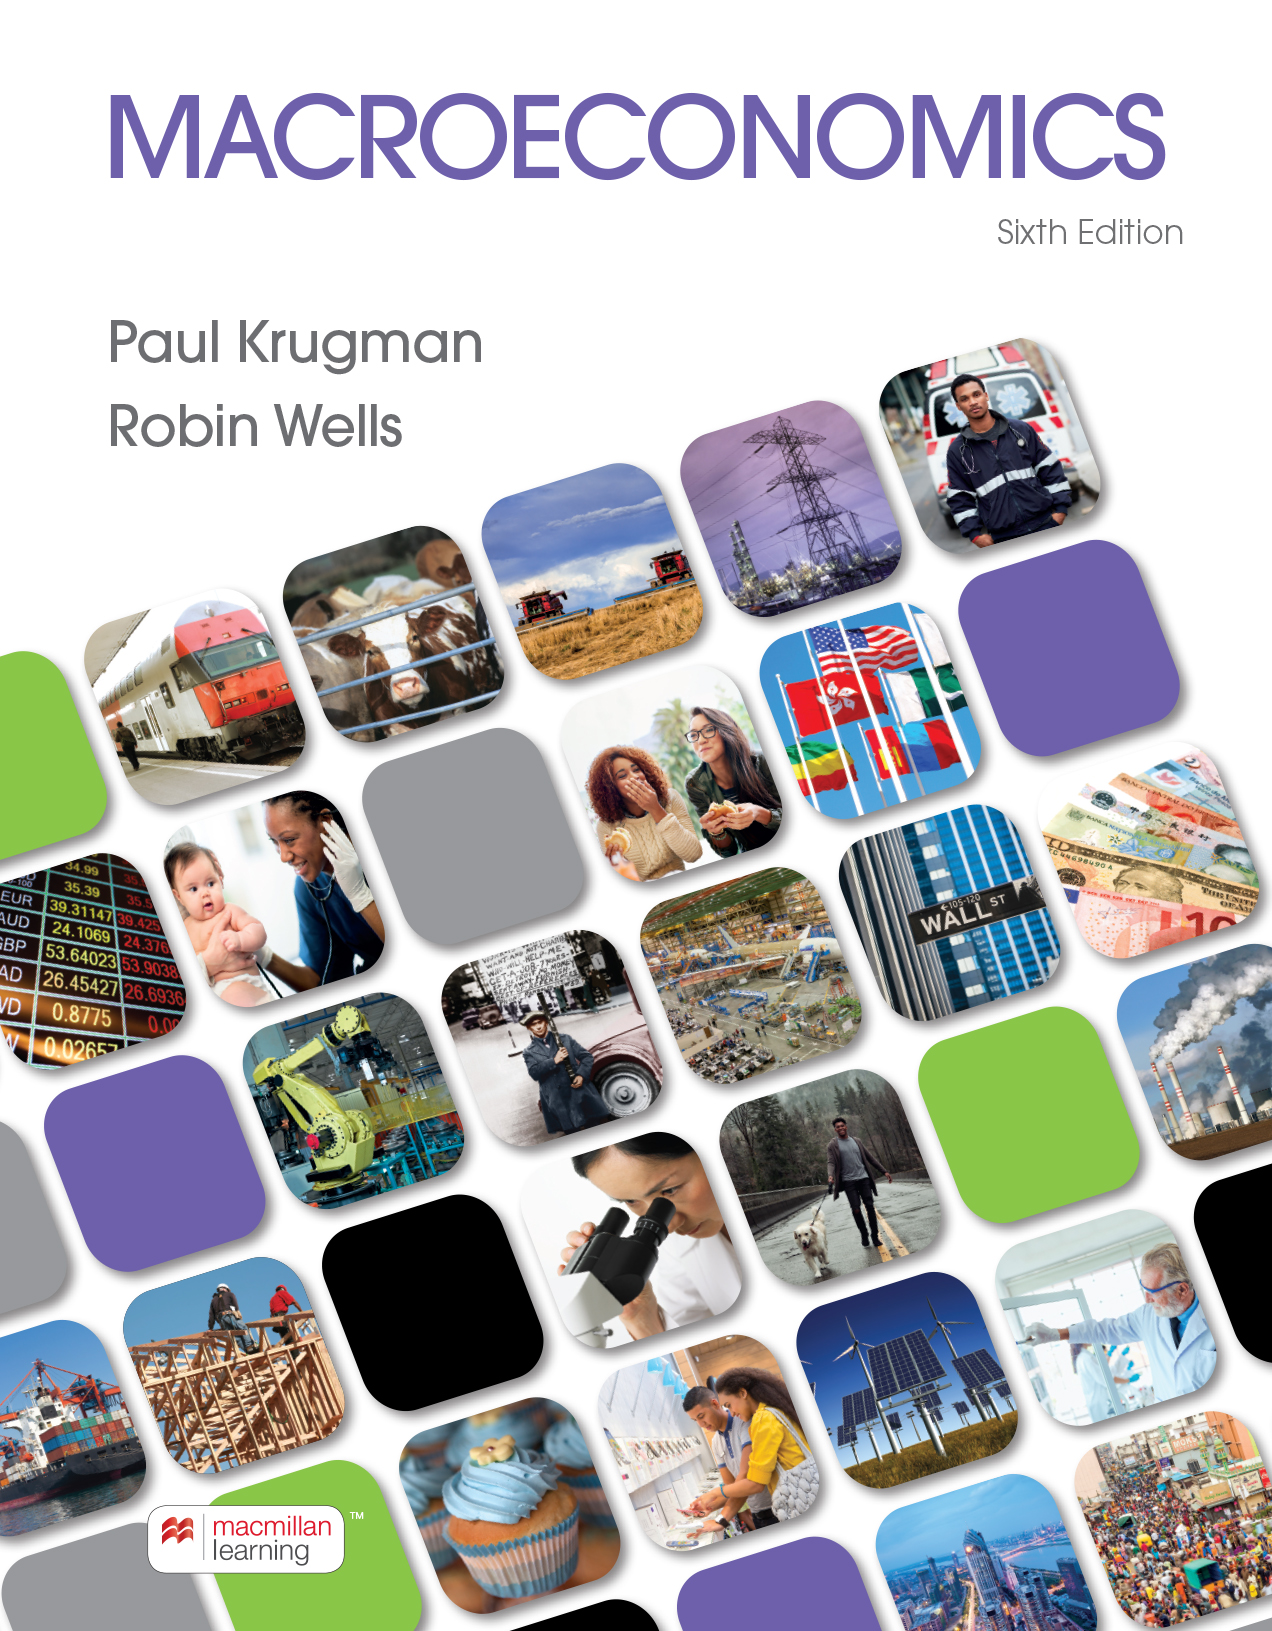
The front cover shows the title Macroeconomics. The edition number below the title reads Sixth Edition. The author names Paul Krugman and Robin Wells are mentioned below the title and edi-tion number. The bottom portion of the front cover page has many photo thumbnails arranged in rows. The row arrangement of the thumbnails is oriented diagonally from the bottom left. The bottom left of the front cover page is affixed with a Macmillan Learning logo.
 for Macroeconomics
Achieve is a comprehensive set of interconnected teaching and assessment tools. It incorporates the most effective elements from Macmillans market-leading solutions in a single, easy-to-use platform. Our resources were co-designed with instructors and students, using a foundation of learning research and rigorous testing.
Achieve is an online learning system that supports students and instructors at every step, from the first point of contact with new content to demonstrating mastery of concepts and skills. Powerful resources including an integrated e-book, robust homework, and a wealth of interactives create an extraordinary learning resource for students.
Every asset you can assign in Achieve is tagged to a learning objective. Insights and reporting help instructors and students understand how they are performing against objectives, enabling more efficient and effective interventions.
Developed by two pioneers in active-learning methods Eric Chiang, Florida Atlantic University, and Jos Vazquez, University of Illinois at Urbana-Champaign pre-class tutorials foster basic understanding of core economic concepts before students ever set foot in class. Students watch pre-lecture videos and complete bridge questions that prepare them to engage in class. Instructors receive data about student comprehension that can inform the lecture preparation.
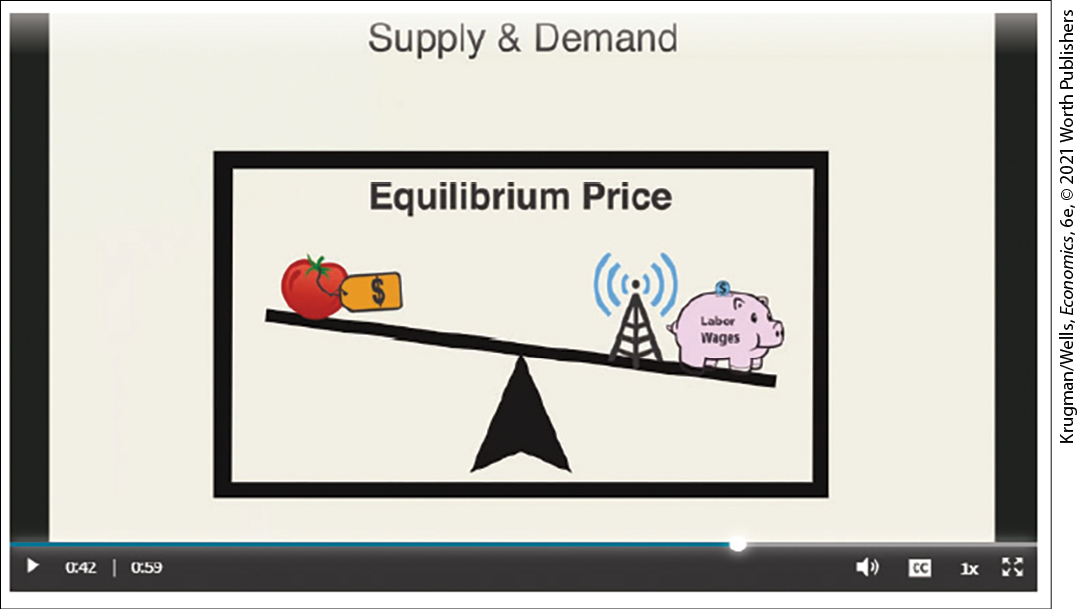
The video shows a frame titled Equilibrium Price, which depicts a lever supported by a fulcrum at the middle. The left side of the lever has a tomato with a price tag on it. The right side of the lever has a pig labeled Labor Wages and a radio tower. The lever is slightly lower on the right side.
With a game-like interface, this popular and effective quizzing engine offers students a low-stakes way to brush up on concepts and help identify knowledge gaps. Questions are linked to relevant e-book sections, providing both the incentive to read and a framework for an efficient reading experience.
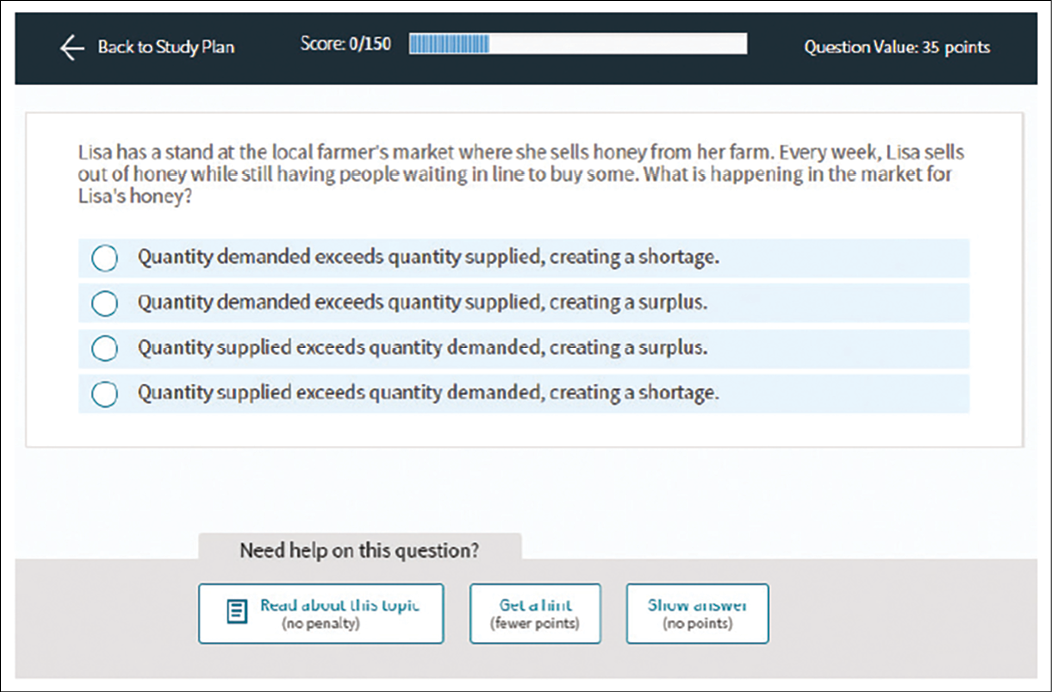
The screenshot contains a question with four options. The panel at the top of the screen shows Back to study plan, Score: 0 out of 100, and question value: 35 points from left to right. The panel at the bottom of the screen shows Need help on this question with three text boxes as follows, read about this topic, Get a hint, and show answers.
The guides provide instructors with a structured plan to facilitate an activity that encourages student engagement in both face-to-face and remote learning courses. Each guide is based on a single topic and allows students to participate through questions, group work, presentations, and/or simulations. The guide displays the activity type, estimated prep and class time, implementation instructions, suggestions for remote implementation where applicable, and Learning Objectives and Blooms level for ease of use. Our Instructor Activity Guides encourage engagement from a Pre-Class Reflection question to prime student interest and offer follow-up iClicker questions to measure comprehension.
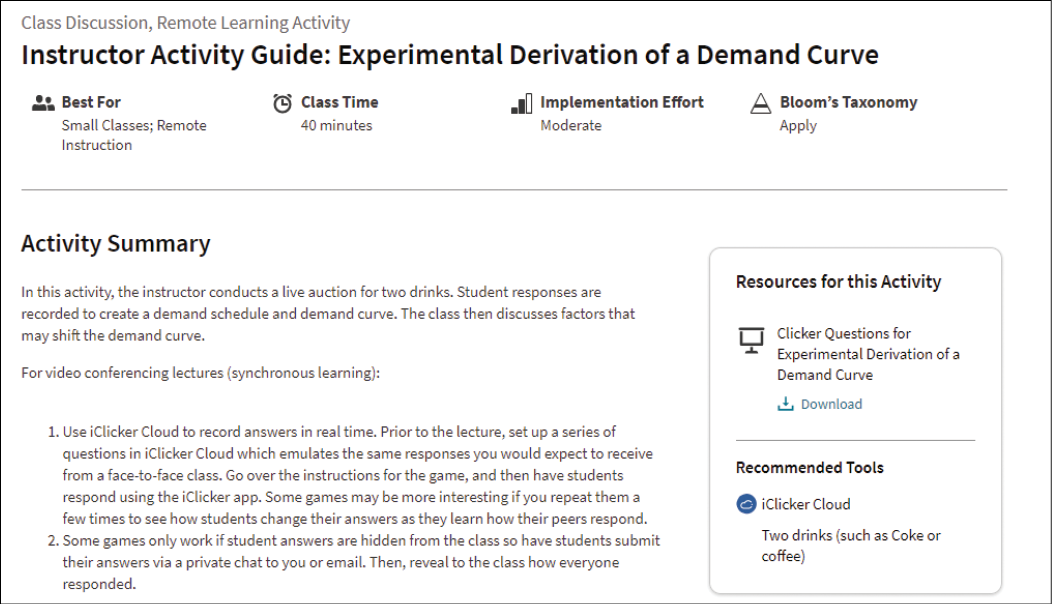
The top left of the screenshot titled Instructor Activity Guide: Experimental Derivation of a Demand Curve, reads Classroom Discussion, Remote Learning Activity. Four icons below the title read, Best For, Class Time, Implementation Effort, and Blooms Taxonomy. Activity Summary with text is displayed on the left of the screen. On the right of the screen, Resources for this activity is mentioned. On the bottom right of the screen, Recommended tools is mentioned.
The Achieve e-book allows students to highlight and take notes; instructors can choose to assign sections of the e-book as part of their course assignments. The e-book includes step-by-step graphs for complex figures.
Available in the e-book, step-by-step graphs mirror how an instructor constructs graphs in the classroom. By breaking down the process into its components, these graphs create more manageable chunks for students to understand each step of the process.
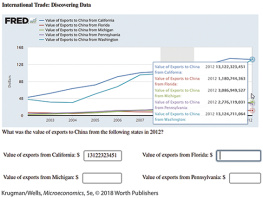
These exercises require students to use the Federal Reserve Economic Database (FRED) related to the concepts discussed in the chapter. Students will get practical experience manipulating data by being asked, for example, to track the impact of a sales tax on tobacco sales. In working these problems, students will gain a greater understanding of core concepts while also working with an impressive data resource.
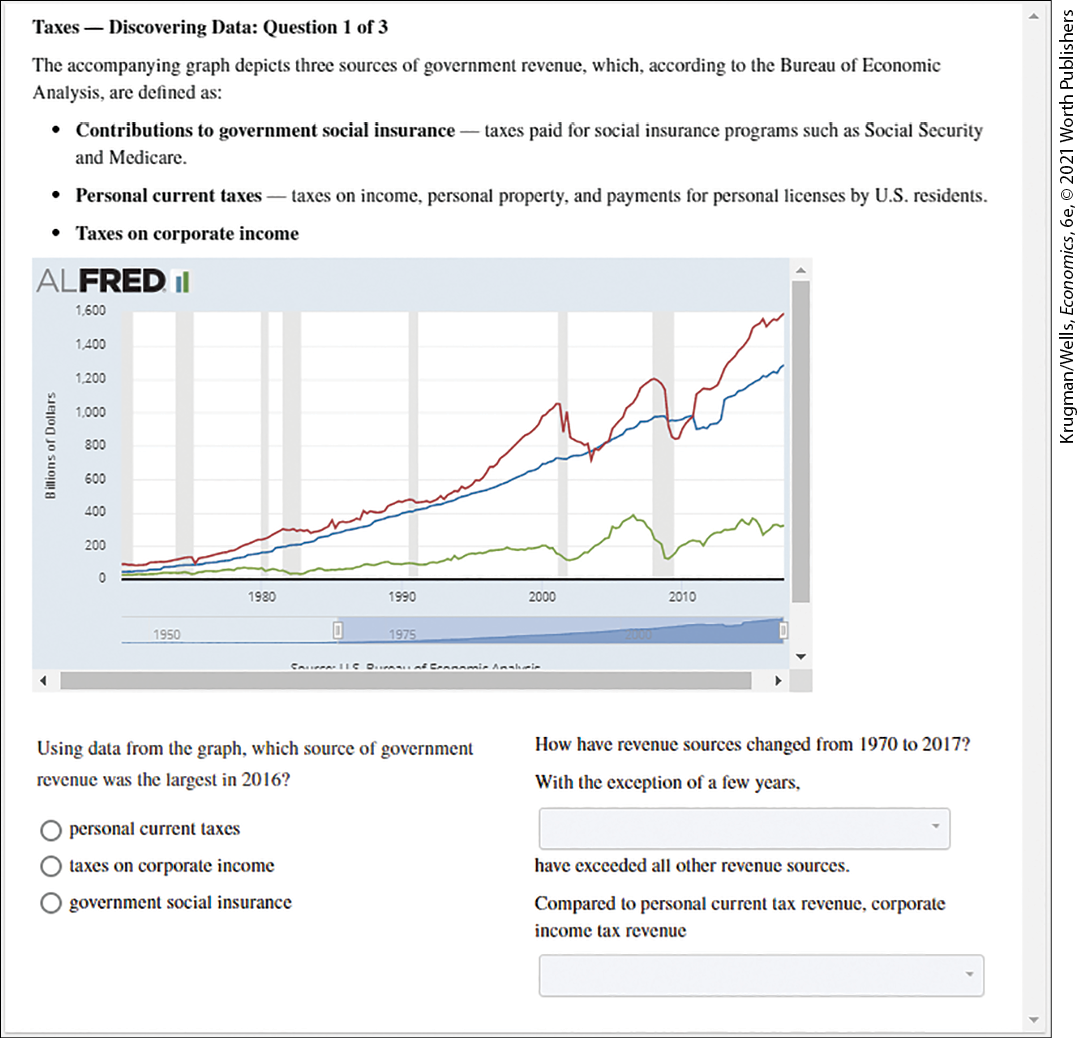
The heading of the screenshot reads, Taxes, Discovering Data: Question 1 of 3, followed by a list and a graph. The graph titled Alfred has a horizontal axis labeled years and a vertical axis labeled Billions of Dollars. The graph is followed by a multiple-choice question with three options at the bottom left and two questions with the drop down menu at the bottom right.
These skill-building activities pair sample end-of-chapter problems with targeted feedback and video explanations to help students solve problems step by step. This approach allows students to work independently, tests their comprehension of concepts, and prepares them for class and exams.
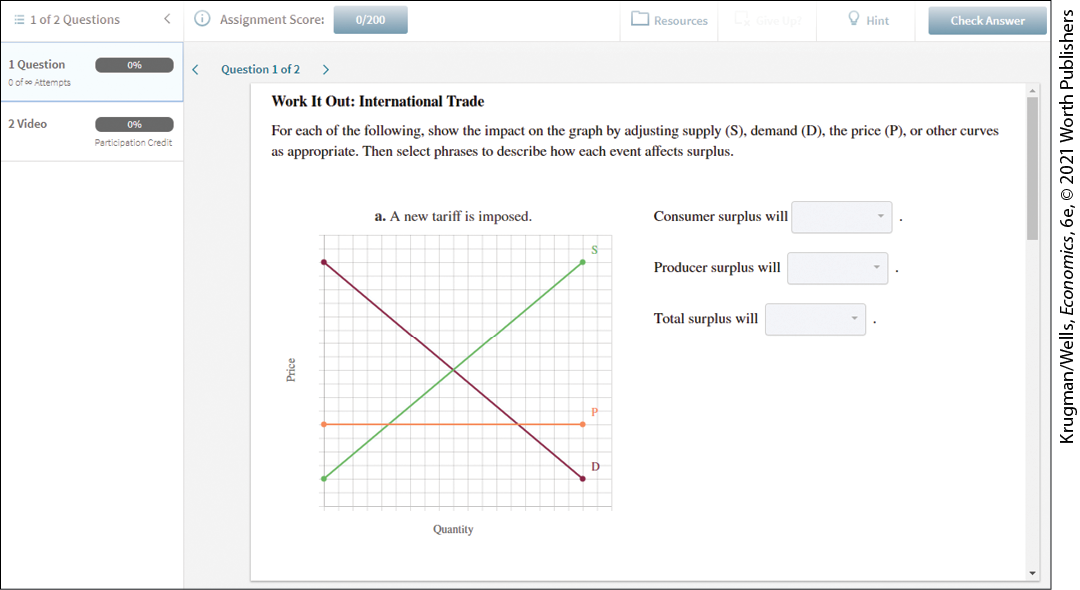
The top panel of the screenshot reads, 1 of 2 questions, Assignment score, Resources, Hint, and Check Answer, from left to right. The top left panel reads, 1 Question and 2 Video, from top to bottom. Question 1 of 2 titled Work It Out: International Trade is followed by text and a graph. The graph titled A new tariff is imposed has the vertical axis labeled Price and the horizontal axis labeled Quantity. The graph plots 3 lines, labeled D, S, and P. At the right of the graph, three drop down menus with a text are present.
Next pageFont size:
Interval:
Bookmark:
Similar books «Macroeconomics»
Look at similar books to Macroeconomics. We have selected literature similar in name and meaning in the hope of providing readers with more options to find new, interesting, not yet read works.
Discussion, reviews of the book Macroeconomics and just readers' own opinions. Leave your comments, write what you think about the work, its meaning or the main characters. Specify what exactly you liked and what you didn't like, and why you think so.

