Contents
Guide
Published by Rowman & Littlefield
An imprint of The Rowman & Littlefield Publishing Group, Inc.
4501 Forbes Boulevard, Suite 200, Lanham, Maryland 20706
www.rowman.com
6 Tinworth Street, London, SE11 5AL, United Kingdom
Distributed by NATIONAL BOOK NETWORK
Copyright 2020 by Andrew Belasco, Dave Bergman, and Michael Trivette
All rights reserved. No part of this book may be reproduced in any form or by any electronic or mechanical means, including information storage and retrieval systems, without written permission from the publisher, except by a reviewer who may quote passages in a review.
British Library Cataloguing in Publication Information Available
Library of Congress Control Number: 2020932428
 The paper used in this publication meets the minimum requirements of American National Standard for Information SciencesPermanence of Paper for Printed Library Materials, ANSI/NISO Z39.48-1992.
Before the birth of the modern internet, savvy teens seeking information on prospective colleges cracked open the latest Yellow Pages-thick college guidebook, eager to soak in school-specific admissions data that felt like classified information. Possessors of such guidebooks were the true insiders of the day, privy to admissions statistics that simply could not be found within the glossy brochures delivered to the masses via snail mail. By 2020, those oversized volumes have been rendered far less essential. Basic admissions data such as SAT ranges, grade point averages, tuition costs, and acceptance rates are available via fast and free Google searches. Everyone is nowat least in 1980s or 90s termsan insider.
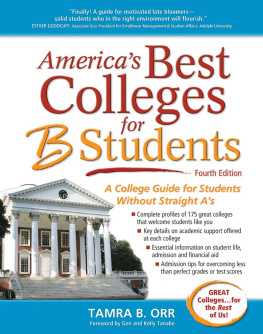
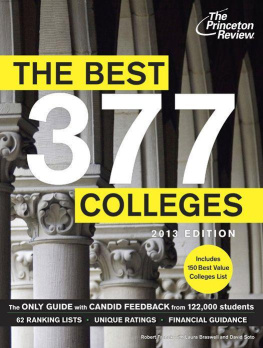
The formula for these annual editions is simple. Easy-to-find admissions and tuition data points are complemented by blocks of heavily anecdotal text designed to reveal something about the campus milieu: the quality of food, the architectural style of the buildings, the political leanings of the student body, and the subjective like. While these books all serve as useful starting points for your college search (we read them ourselves each year), they fail to acknowledge the seismic shift taking place in the national conversation about higher educationthe idea that students should stop obsessing over gaining admission into the most prestigious schools that will accept them and instead ask, What can a given college do for me? If students/parents are going to pony up $200,000 or more in tuition alone, they should first demand to see outcomes data, return on investment (ROI) figures, and a statistically backed account of unique opportunities for undergraduates. Thats where the college guide youre holding comes into play.
Why do I need this guide?
There are two main reasons:
(1) Given the absurd cost of a college education, finding a school that will provide an acceptable ROI has never been more challenging.
(2) Your prospective colleges are likely to be more selective than they were only a few years ago; greater information gathering/strategic planning will be required to successfully gain admission.
Lets begin with the issue of price. As we get older, its easy to fall into a nostalgic trap on the subject of how much things cost. For example, When I was a boy, you could feed a family of four for a Buffalo nickel. Yet when it comes to lamenting rising college expenses, there is actual data to back up the sticker shock. In 1950, the University of Pennsylvania charged $600 per year to attendroughly $6,000 in 2020 money. Today, Penns annual cost of attendance is over $77,000. By 1960, most private institutions charged an annual fee of $1,500 $2,000 that equates to $12,000$16,000 today. In the current marketplace, a $50,000 annual tuition is considered reasonable. This is hardly just a private school phenomenon. The University of North Carolina at Chapel Hills in-state 201920 tuition cost of $9,018 is one of the best bargains in all of higher education. Of course, that pales in comparison to the in-state tuition of thirty years agoonly $504 per year. (No, thats not a typo).
Turning to the matter of increased selectivity, you dont need to look back to the 50s, 60s, or even 70s to find a college admissions landscape vastly different from todays hyper-competitive environment. In 1980, nearly half of all applicants were accepted into prestigious Swarthmore College while the Class of 2022 had a 9 percent acceptance rate. As recently as the 1990s, the University of Chicago accepted 6070 percent of those who applied, but for applicants to the Class of 2022, only 7 percent were successful. Less drastic but still significant changes have proliferated as the overwhelming majority of desirable public and private schools have grown more selective in recent years. As of the publication of this book, many of the most prestigious schools in the country boast single-digit acceptance rates, including all the Ivy League schools (except Cornell University, which is a fraction over 10 percent) as well as Stanford University, Johns Hopkins University, Duke University, Northwestern University, Vanderbilt University, and the Massachusetts Institute of Technology. Other elite schools including Pomona College, Bowdoin College, Williams College, Amherst College, Rice University, and the University of Southern California all have inched closer to the single-digit club and will likely join it soon.
The reasons for this increased level of selectivity include an influx of highly-qualified foreign students applying to US colleges, the Common App making it easier for top students to apply to as many elite schools as they wish, and a greater number of applicants paying for services, such as private SAT tutors, that ultimately enhance their academic profiles.
How to use this guide:
We hope the above statistics have convinced you that the college selection and admissions process has never been more of a high-stakes game. Parents/students who are about to essentially take out another mortgage to finance their own or their teens college education should, at the very least, first perform the equivalent of a home inspection. Just as it is easy to fall in love with a house based on a Zillow photo, many select a college based on surface observations such as the campus is pretty, the school colors would look nice on a bumper sticker, or youve heard good things from other parents in your social circle. Think of this guidebook as an inspection report with no crawlspace left unexplored.
Each profile includes six statistically rich narrative sections and two tables containing in excess of seventy additional data points. The following is a brief overview of the information included for each school and why it is important for prospective college students (and their parents) to know.
Inside the Classroom
We begin each profile by discussing what makes a given institution academically unique. Some schools have a core curriculum that dictates three semesters of study; others have an entirely open curriculum. Some mandate foreign language, physical education, a freshman seminar or two, and a senior thesis; others have no such requirements. Statistics on class size, undergraduate research opportunities, study abroad participation andwhen possibleinstitutional survey data regarding professor availability and the quality of classroom instruction are included. In this section we also highlight particular programs/departments that have standout reputations as well as how seniors fare in landing nationally competitive postgraduate scholarships.





 The paper used in this publication meets the minimum requirements of American National Standard for Information SciencesPermanence of Paper for Printed Library Materials, ANSI/NISO Z39.48-1992.