First published by Verso 2014
Danny Dorling 2014
All rights reserved
The moral rights of the author have been asserted
Verso
UK: 6 Meard Street, London W1F 0EG
US: 20 Jay Street, Suite 1010, Brooklyn, NY 11201
www.versobooks.com
Verso is the imprint of New Left Books
eBook ISBN: 978-1-78168-586-0
Trade Paperback ISBN: 978-1-78168-585-3
British Library Cataloguing in Publication Data
A catalogue record for this book is available from the British library
Library of Congress Cataloging-in-Publication Data
Dorling, Daniel.
Inequality and the 1% / Danny Dorling. 1st Edition.
pages cm
1. EqualityGreat Britain. 2. PovertyGreat Britain.
3. Social classesGreat Britain. I. Title. II. Title:
Inequality and the one percent.
HM821.D6697 2014
305.50941dc23
v3.1
To Carl Lee who knows what matters most
Contents
1
Can We Afford the Superrich?
The most important problem we are facing now, today is rising inequality.
Growing income and wealth inequality is recognised as the greatest social threat of our times. Robert Shiller suggests that the renewed greed of the top 1 per cent has had worse effects than even the financial crash of 2008. The top 1 per cent contribute to rising inequality, not just by taking more and more, but by suggesting that such greed is justifiable and using their enormous wealth to promote that concept. As
For the first time in generations, there is now serious debate over the that to be untrue, leaving 11 per cent unsure. More and more people are learning how the rich reduced their tax rates, weakened trade unions and for a time made the idea of avoiding tax acceptable.
To qualify to be a member of the top 1 per cent in the UK, you need a total household income, before tax, of about 160,000 a year. This estimate is for a childless couple. Should you be single, you can enter the 1 per cent with a little less; should you have children, youll need a somewhat higher household income. These statistics and evidence of a recent contraction of inequality within the 99 per cent all come courtesy of the According to that respected body, as the very richest become richer, the rest of us are becoming more equal. However, growing equality within the 99 per cent does us little good when those at the very top keep on taking more and more.
In the UK members of the general public are now surer that the
In the UK, dwindling numbers believe the rich generate wealth which all the rest of us get to share, but among them are some prominent people who use their position to promote this belief. There are many multi-millionaires who financially support right-wing think tanks to argue on their behalf. An even smaller, richer group with great influence are the mega-rich owners of newspapers and television channels, but they all now face growing opposition.
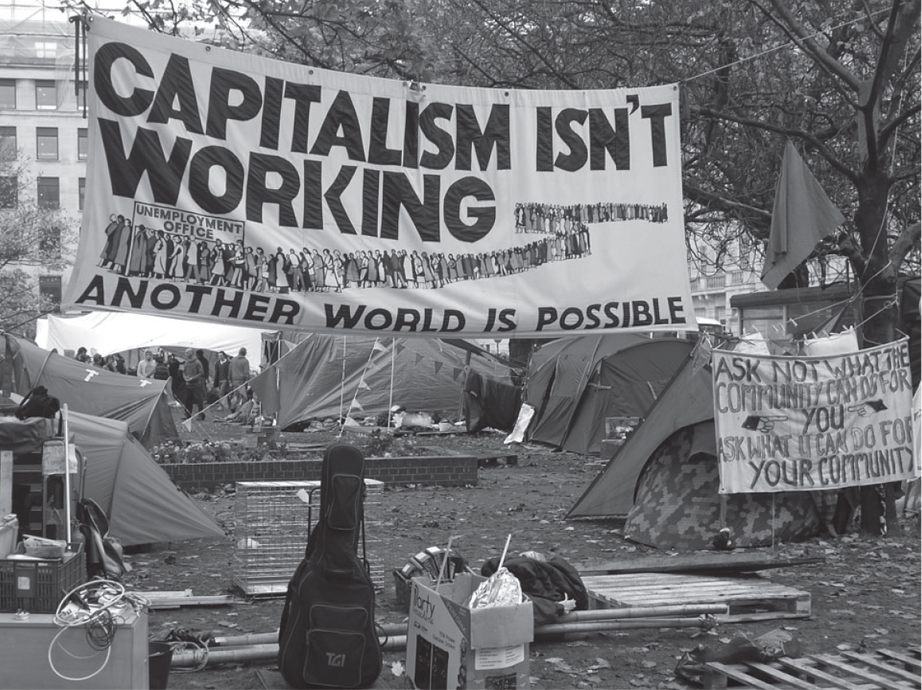
Alan Denney
Occupy London, 2011
Around the world, a majority of the global protests that have occurred since January 2006 have centred on issues of economic justice. In 2006 there were just 59 large protests recorded worldwide. In just the first half of 2013 there were 112 protests of a similar size. The rate of large-scale global protest has increased almost fourfold in six years. And these protests are more prevalent in higher income countries countries where most of the 1 per cent live. Why is this?
There is growing social cohesion among protestors worldwide because the vast majority of people in a majority of rich countries are now suffering as a result of growing inequalities. Since 2008, after the initial shock of the drop in the value of their stock holdings, the rich in both the US and the UK manoeuvred to become much richer. In contrast, in the UK, even before 2008, inequalities were already falling within the 99 per cent. But it only became clear after 2008 that there was an increasing gap between the 1 per cent and all of the Now even some of the most well-connected lackeys of the very rich are working for less and less reward.
The vast majority of us are becoming both more equal and often poorer than we were in 2008. In the UK the bottom 99 per cent now have more in common than has been the case for a generation. Some 99 per cent of us are increasingly all in it together. It is the top 1 per cent who increasingly are not part of this new austerity norm. As the economists at the IFS explained in 2013, Over the past two decades inequality among the bottom 99 per cent has fallen: the Gini coefficient for the bottom 99 per cent was 5 per cent lower in 2011/12, at 0.30, than in 1991.
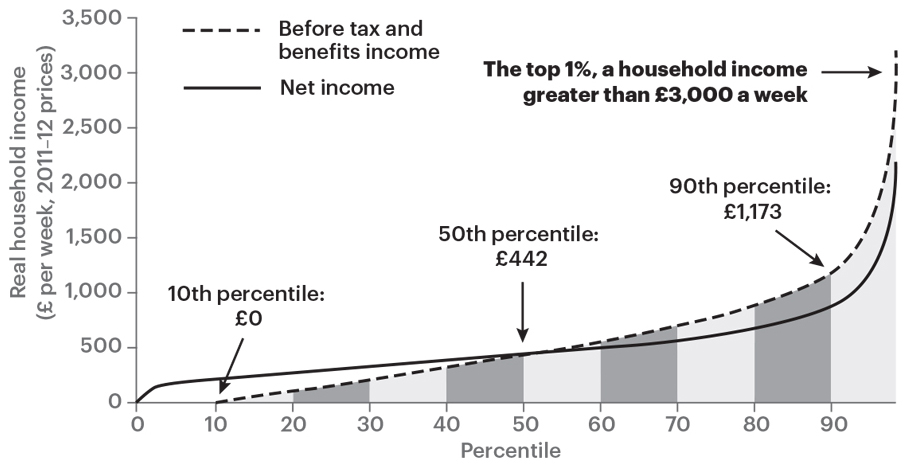
In 2011/12, the average couple without children in the UK took home 442 a week from earnings, just under 23,000 a year (see shows, they survive on about a fifth of the weekly earnings of an average childless couple in the best-off 10 per cent.
Note: All incomes are expressed in terms of equivalent amounts for a childless couple.
Source: IFS calculations using the Family Resources Survey 201112
Figure 1.1 Look up your weekly household earnings to find your rank
Inequality can be measured in many ways, and this can cause confusion. Many different figures can be used. The ratio of five just quoted can be easily lowered if the private education or pension contributions paid by the richer couple are deducted, or it can be made to appear much higher if the average income of all of the top 10 per cent is used, rather than the income of the median (midpoint) couple among the top 10 per cent. Taking children into account complicates the picture further. Finally, calculating entire distribution measures of inequality, such as the Gini coefficient, tends to cause many more readers eyes to glaze over.
Fortunately there is a strong correlation between the complex Gini coefficient of income inequality (measured after tax and benefits and adjusting for household size) and the simple measure of how much of total income the best-off 1 per cent receives each year. When the 1 per cent receives a low proportion of national income, inequality for the rest of the population is forced to be lower, because no other group can receive more than the best-off 1 per cent. Simply concentrating on the share taken by the 1 per cent is enough. It may even be one of the best measures of inequality to consider in terms of how simple a target it may be for effective social policy.
Economists have measured the fortunes of the best-off 1 per cent for decades. Only recently have political activists, campaigners, and even those anarchists who most distrust economists become as interested in these statistics. In 2011 However, not all of the 99 per cent are unfulfilled, and many of the 1 per cent undertake work they find dull just to remain in that income bracket though their income often means that in the rest of life they have choices that others can only dream of, other than the choice to be normal.
Before discussing what it is to be normal, we need a better grasp of just how unusual the 1 per cent have become, and especially of how much inequality there is within the 1 per cent: far more than within the 99 per cent. A pre-tax That is more than twice as much as the least well-off of the 1 per cent received.


