Table of Contents
For Candice
INFOGRAPHICS: AN INTRODUCTION TO LEARNING
Confucius famously wrote, You cannot open a book without learning something. Yeah, right. Give it a shot. Pull the nearest book from your shelf, open it to any random page, and stare blankly at it. Learn anything? Chances are youll glean nothing; at best youll have spent a relaxing moment in thoughtless meditation. Confucius may have offered us some theoretically sage advice, but in this case he was wrong. Despite his wisdom, he ignored two diametrically opposed facts of human nature:
1. People like knowing things.
2. People hate learning things.
Thus enters our answer to Confuciuss flawed theory: a book composed entirely of single-page information morsels. Revolutionizing the field of illustrative epistemology (the study of picture-based knowledge), we have crafted a tome of anthropological, sociological, and philosophical superknowledge, all easily absorbed while taking a short break from your busy day or using the toilet.
Illustrative epistemologists believe that how we transfer knowledge from one person to the next is the very essence of being human. Throughout our history, scientists and scholars from a host of fields have sought simple qualifiers to define humanitys uniqueness within the animal kingdom. Time and again, though, these supposedly singular traits have proven not so singular. Man, the toolmaker? Hardly. Egyptian vultures use rocks to crack open thick-shelled ostrich eggs. Man, the builder? Not quite. Pesky beavers were erecting elaborate dams long before we were. Man, the artist? Think again. Bowerbirds express their individuality by constructing extraordinarily lavish and often colorful nests. What about our singularly shameful attributes? Man, the wager of war? Relax. Chimpanzees have been known to invade and kill their neighbors for no other reason than to gain new territory.
Our species, Homo sapiens, is Latin for knowing man or wise man, but even our noninstinctual knowledge crown has been usurped from us by a variety of species ranging from apes to monkeys to dolphins to whales, which have been witnessed passing newly acquired knowledge from generation to generation.
In the end, what may be our only truly singular qualifier is man, recorder of knowledge. A mother chimp may teach her children a special technique for retrieving termites from a mound using a stick, but were she to die before passing the skill along, the chain of knowledge would be broken. Only humans have devised ways for acquired knowledge to be passed beyond the limited reach of person-to-person interaction, and, more importantly, beyond the confines of our often too-brief life spans.
Unfortunately, the major knowledge-transfer systems, for all their positives, suffer from what scientists call the Boredom Factor. They simply take too much time or effort away from the modern persons busy schedule of unhappy work and inane leisure distractions. Which is why illustrative epistemology champions the use of information graphics, or, shortened for increasingly shortened attention spans, infographics.
The infographic is a straightforward concept. It simply imparts information that would be cumbersome if rendered in mere text form. In our modern world, infographics are generally used as visual shorthand: street signs, mass-transit maps, which bathroom is meant for men and which is meant for women. Without these infographics, people die.
But the idea behind infographics can be traced back to our prehistory. Before humans had a written language, our Stone Age ancestors were documenting hunting adventures with paint on cave walls. The ancient Egyptians and Mesoamericans adorned their temples with narrative imagery. The Vikings left carved and painted rune stones across Europe, Iceland, Greenland, and northeastern North America documenting their travels. Scholars are just beginning to fully grasp the meanings behind much of this early visual data.
Confucius was taking for granted that people would actually read a book. Illustrative epistemologists recognize that left to their own devices, the average person is simply not going to engage recorded knowledge. After the rigorous tedium of a standard K12 education, most people intentionally disengage from the learning process entirely, content with the assumption that they have acquired enough knowledge to suitably see them to the grave. Learning is a chore, and there are a lot of kittens that need your attention on the Internet.
With the infographic, however, before you even realize it, youve absorbed the information contained within it. The infographic is the Trojan horse of pedagogy. A stealth bomber with an explosive payload of pure data. A wet willy of knowledge inserted into the eager ear.
Our case rested, you should now prepare yourself for a mind-blowing knowledge experience. In your hands lies a staggering swath of modern human scientific and cultural knowledge condensed into one simple volume. If a picture is worth a thousand words, then this book is an entire set of the Encyclopaedia Britannica ready to fit snugly on the lid of your toilet tank.
Feed your mind.
Introduction to Graphic Humor
Flowchart
(Processus cursus)
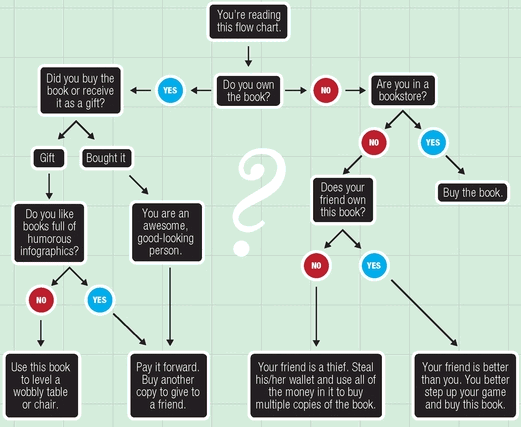
First introduced in 1921 by Frank Gilbreth Sr. to document process flow in industrial engineering, the flowchart quickly became a popular instructional tool in the industrial world (Post 1935). However, the flowchart soon evolved from simply showing the steps of a structured sequence to something akin to a hypothetical journeya process made up of variable steps with variable outcomes.
The flowcharts appeal is that of an expedition, an exploration. Its all the fun of a Choose Your Own Adventure, but with the comfort of fate controlling your course. Flowcharts have become a popular way to visualize the possibilities of such critical situations as You Are Lost in the Desert and You Poured Cereal into a Bowl Before Checking to See if You Had Milk.
What are you reading?
Line Graph
(At linea)
Easily recognizable to high school algebra students or those who think theyre successfully playing the stock market, line graphs track relationships between two different variables. By marking points along the x axis and connecting those dots to form a line, trends and patterns quickly become apparent to even the untrained eye, often allowing observers to notice correlations that would otherwise have gone right over their heads.
The ease with which a trend can be spotted on a line graph has been integral to many important discoveries. For instance, in 1914, Giuseppe Calentori of Italy, a baker by trade but an infographic enthusiast by inclination, began a line chart tracking the daily number of fights he got into with his wife on the y axis compared to time on the x axis. After several months of keeping the chart, Calentori realized that approximately every 28 days there would be a spike, when for several days the arguments with his wife would come even more fast and furious than usual. After some investigation into the cause, Calentori became the first man to discover the concept of PMS (Calentori 1915). Women, of course, had been aware of their monthly cycles since the dawn of time.


