Deaths of Despair and the Future of Capitalism a nne case a ngus deaton Na r r ated by K ate H a r per pr ince ton university pr ess -1 pr ince ton & oxfor d +1 Case_DeathofDespair_CustomeWEB.indd 1 1/16/20 6:19 PM 1,400 1,200 1,000 Deaths per 100,000 1900 1920 1940 1960 1980 2000 figure 1.1. Mortality rates for white American men and women ages 4554 in the twentieth century (deaths per 100,000). Authors calculations using Centers for Disease Control and Prevention data. US white non-Hispanics (USW) Predicted mortality USW France Deaths per 100,000 United Kingdom Sweden 1990 2000 2010 figure 2.1. Age- adjusted mortality rates, ages 4554, for US white non- Hispanics (USW), -1 France, the United Kingdom, and Sweden, and a predicted mortality rate for USW, a 0 counterfactual that assumes the mortality rate for USW would continue falling at 2 percent per +1 year after 1998. Authors calculations using CDC data and the Human Mortality Database.
Case_DeathofDespair_CustomeWEB.indd 2 1/16/20 6:19 PM 2000 100.00-250.00 250.01-300.00 300.01-350.00 350.01-400.00 400.01-450.00 450.01-500.00 2016 500.01-550.00 550.01-600.00 600.01-750.00 750.01-1100.00 figure 2.2. Al - cause mortality rates, white non- Hispanics ages 4554, by small area. Authors calculations using CDC data. -1 +1 Case_DeathofDespair_CustomeWEB.indd 3 1/16/20 6:19 PM US white non-Hispanics Ireland UK Deaths per 100,000 Canada Australia 1990 2000 2010 figure 3.1. Age- adjusted heart disease mortality rates for men and women ages 4554. Authors calculations using Centers for Disease Control and Prevention and World Health Organ ization data.
Less than BA Deaths per 100,000 BA or more 1990 1995 2000 2005 2010 2015 -1 figure 4.1. Suicide, drug overdose, and alcoholic liver disease mortality in Kentucky, by 0 educational attainment, white non- Hispanics ages 4554. Authors calculations using Centers +1 for Disease Control and Prevention data. Case_DeathofDespair_CustomeWEB.indd 4 1/16/20 6:19 PM Men, less than BA Women, less than BA Deaths per 100,000 Men, BA or more Women, BA or more 1995 2000 2005 2010 2015 figure 4.2. Drug, alcohol, and suicide mortality, white non- Hispanics ages 4554. Authors calculations using Centers for Disease Control and Prevention data.
Data are adjusted for increases in average age within the age- group. Less than BA BA or more 1985 1980 1975 19701965 1960 1955 1950 1945 1965 1975 1970 1960 1945 1955 Deaths per 100,00 1940 1985 1935 1980 1940 1935 Age Age figure 4.3. Alcohol, drug, and suicide mortality, white non- Hispanics, by birth cohort 19922017. Authors calculations using Centers for Disease Control and Prevention data. -1 +1 Case_DeathofDespair_CustomeWEB.indd 5 1/16/20 6:19 PM 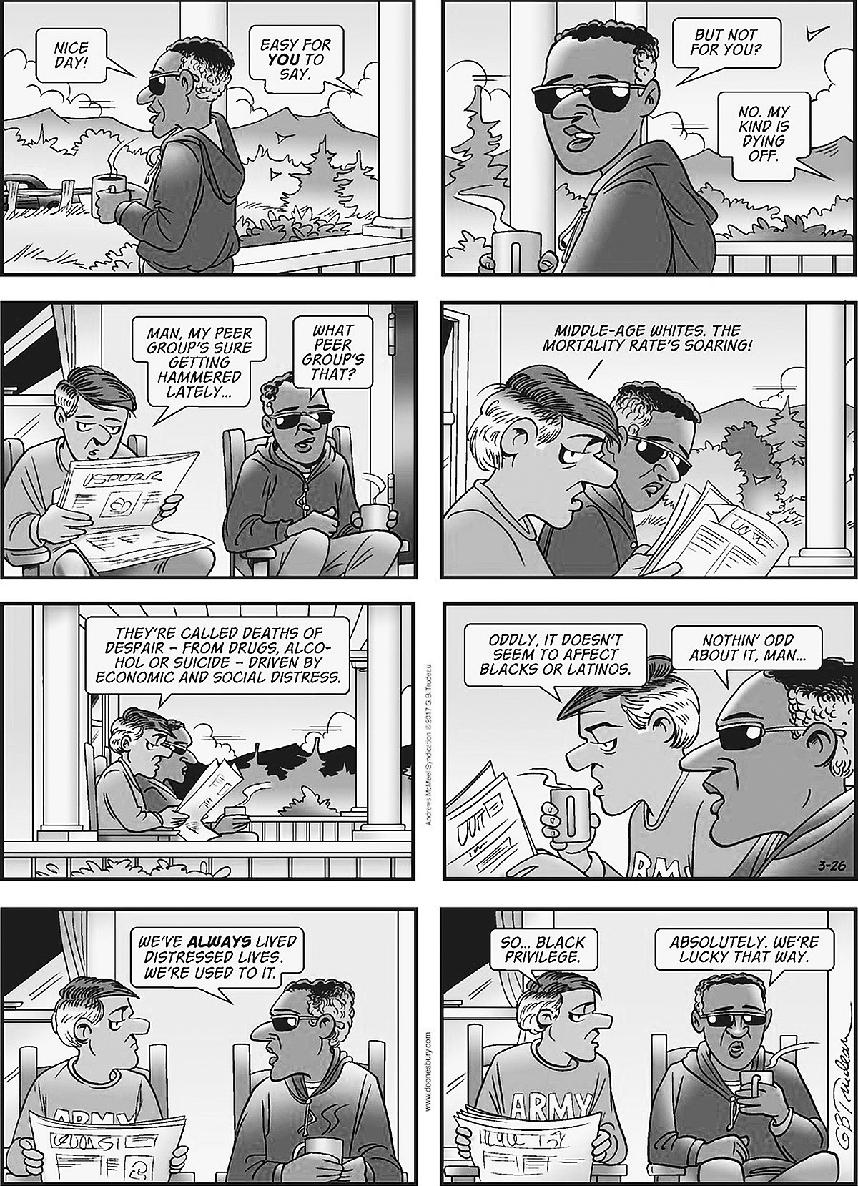 Doonesbury 2017 G. Trudeau. Trudeau.
Reprinted with permission of Andrews McMeel Syndication. All rights reserved. -1 +1 Case_DeathofDespair_CustomeWEB.indd 6 1/16/20 6:19 PM 1,400 1,200 1,000 Black Deaths per 100,000 White 1970 1980 1990 2000 2010 figure 5.1. Mortality rates for blacks and whites ages 4554, 19682017. Authors calculations using Centers for Disease Control and Prevention data. White, less than BA Black, less than BA Deaths per 100,000 White, BA or more Black, BA or more 1990 2000 2010 2020 figure 5.2.
Drug, alcohol, and suicide mortality in midlife, 19922017, blacks and whites, with and without a college degree. Authors calculations using Centers for Disease Control -1 and Prevention data, ages 4554 (age- adjusted). +1 Case_DeathofDespair_CustomeWEB.indd 7 1/16/20 6:19 PM Less than BA BA or more 0.3 0.2 2017 ting fair or poor health 0.1 2007 1993 2017 tion repor 2007 ac 0.0 1993 Fr Age Age figure 6.1. Fraction of white non- Hispanics reporting fair or poor health, 19932017. Authors calculations using the BRFSS. Less than BA BA or more 0.06 20072010 20142017 ting 0.04 20022005 tion repor 19972000 ac 0.02 Fr 20142017 0.00 19972000 Age Age figure 6.2.
Serious mental distress, white non- Hispanics, by education. Authors calculations using the NHIS. -1 +1 Case_DeathofDespair_CustomeWEB.indd 8 1/16/20 6:19 PM 0.12-0.21 0.22-0.26 0.27-0.30 0.31-0.37 0.38-0.50 figure 7.1. The geography of pain, white non- Hispanics ages 2564, 200817. Authors calculations using Gallup tracking data. 0.35 0.30 US Whites ting pain 19 comparison countries 0.25 0.20 US Whites with a BA tion of people reporac 0.15 Fr 0.10 Age figure 7.2.
Fractions who experienced pain yesterday, US whites and comparison countries. -1 Authors calculations using Gallup tracking data and Gallup World Pol . +1 Case_DeathofDespair_CustomeWEB.indd 9 1/16/20 6:19 PM Less than BA BA or more 0.65 195059 196069 194049 194049 197079 0.55 193039 195059 ting pain 198089 196069 0.45 197079 tion reporac 0.35 198089 Fr 0.25 Age Age figure 7.3. Fraction of white non- Hispanics experiencing neck, back, or joint pain, by birth cohort and education, 19972017. Authors calculations using the NHIS. Birth year 1945 Birth year 1970 Less than BA Less than BA Deaths per 100,000 BA or more BA or more 1990 2000 2010 2020 2000 2010 2020 figure 8.1.
Suicide rates, white non- Hispanics, by year of birth and education. Authors calculations using Centers for Disease Control and Prevention data. -1 +1 Case_DeathofDespair_CustomeWEB.indd 10 1/16/20 6:19 PM Less than BA BA or more 3.5 3.0 1975 1965 2.5 1955 Number of drinks 1975 2.0 1945 1965 1955 1935 1945 1935 1.5 Age Age figure 8.2. Average drinks per occasion when drinking, US whites by birth cohort. Authors calculations using the BRFSS. West Virginia Maryland Ohio Delaware Pennsylvania New Jersey New Hampshire Kentucky Florida Maine Connec C ticut Rhode Island ticut Massachusetts Deaths per 100,000 Mississippi Arkansas Minnesota Nebraska Iowa 0.05 0.10 0.15 0.20 White non-Hispanic poverty rate 2017, by state -1 figure 10.1.
Drug overdose death rates for white non- Hispanics ages 2564 and state poverty rates for white non- Hispanics in 2017. Authors calculations using Centers for Disease +1 Control and Prevention data and the March Current Population Survey. Case_DeathofDespair_CustomeWEB.indd 11 1/16/20 6:19 PM Heart disease + drugs, alcohol, suicide 150 Heart disease Deaths per 100,000 Drugs, alcohol, suicide 1990 2000 2010 2020 figure 10.2. Mortality rates from heart disease and deaths of despair for white non-Hispanics ages 4554 (age- adjusted). Authors calculations using Centers for Disease Control and Prevention data. 1975 1955 1940 BA or more Less than BA 1940 1990 1955 1975 Median real wages $2017 1990 Age -1 figure 11.1.
Median earnings, white non- Hispanic men by birth cohort, with and without a bachelors degree. Authors calculations using the Current Population Survey. +1 Case_DeathofDespair_CustomeWEB.indd 12 1/16/20 6:19 PM 1.0 Men, BA or more 0.9 Women, BA or more tion 0.8 acFr Men, less than BA 0.7 Women, less than BA 0.6 1980 1990 2000 2010 2020 figure 11.2. Employment- to- population ratios, white non- Hispanic men and women, ages 2554. Recessions noted by vertical lines in the year the recession started. Authors calculations using the Current Population Survey.
Less than BA BA or more 0.9 1980 1990 2000 2010 2018 1980 0.8 1990 0.7 2000 tion marriedac 2010 Fr 0.6 2018 0.5 Age Age figure 12.1. Fraction of white non- Hispanics who are currently married, by age, year, and education. Authors calculations using the Current Population Survey. -1 +1 Case_DeathofDespair_CustomeWEB.indd 13 1/16/20 6:19 PM 1.0 Black non-Hispanic BA or more 0.9 White non-Hispanic 0.8 Black non-Hispanic tion votingacFr 0.7 Less than BA White non-Hispanic 0.6 1990 2000 2005 2010 2015 figure 12.2. Presidential election turnout, by race and education, ages 2564. 0.35 ly With a BA 0.30 Without a BA 0.25 tion attending church weekacFr 0.20 1970 1980 1990 2000 2010 2020 figure 12.3. 0.35 ly With a BA 0.30 Without a BA 0.25 tion attending church weekacFr 0.20 1970 1980 1990 2000 2010 2020 figure 12.3.
Next page






 Doonesbury 2017 G. Trudeau. Trudeau.