• Complain

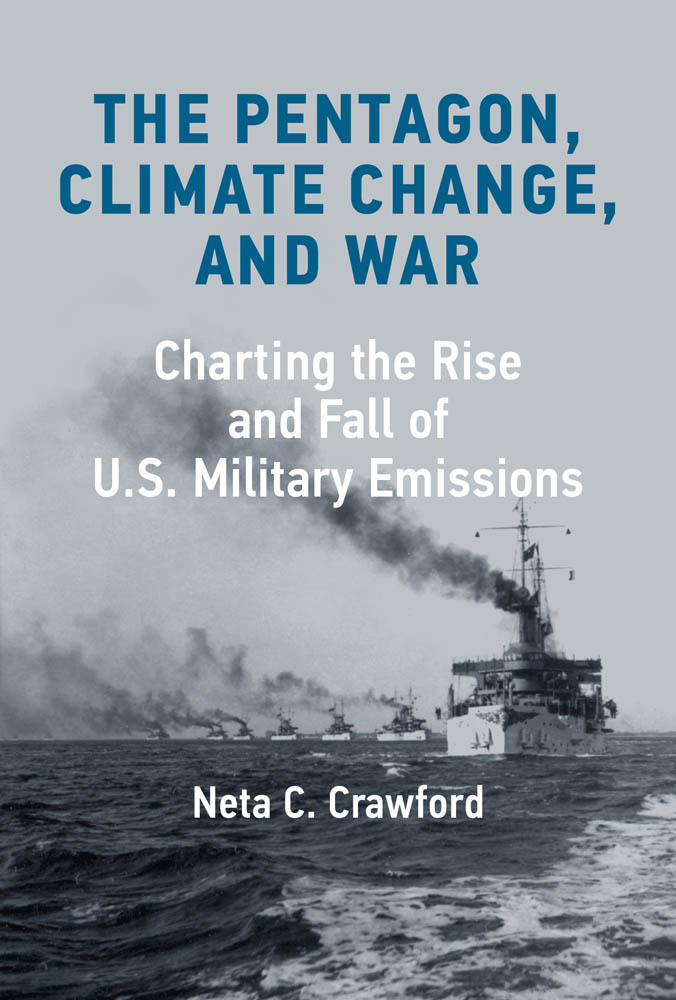
Neta C. Crawford - The Pentagon, Climate Change, and War: Charting the Rise and Fall of U.S. Military Emissions

Here you can read online Neta C. Crawford - The Pentagon, Climate Change, and War: Charting the Rise and Fall of U.S. Military Emissions full text of the book (entire story) in english for free. Download pdf and epub, get meaning, cover and reviews about this ebook. City: Cambridge, year: 2022, publisher: The MIT Press, genre: Science / Politics. Description of the work, (preface) as well as reviews are available. Best literature library LitArk.com created for fans of good reading and offers a wide selection of genres:

Romance novel Science fiction Adventure Detective Science History Home and family Prose Art Politics Computer Non-fiction Religion Business Children Humor

Choose a favorite category and find really read worthwhile books. Enjoy immersion in the world of imagination, feel the emotions of the characters or learn something new for yourself, make an fascinating discovery.

No cover
  • Book:
    The Pentagon, Climate Change, and War: Charting the Rise and Fall of U.S. Military Emissions
  • Author:
  • Publisher:
    The MIT Press
  • Genre:
  • Year:
    2022
  • City:
    Cambridge
  • Rating:
    4 / 5
  • Favourites:
    Add to favourites
  • Your mark:
    • 80
    • 1
    • 2
    • 3
    • 4
    • 5

The Pentagon, Climate Change, and War: Charting the Rise and Fall of U.S. Military Emissions: summary, description and annotation

We offer to read an annotation, description, summary or preface (depends on what the author of the book "The Pentagon, Climate Change, and War: Charting the Rise and Fall of U.S. Military Emissions" wrote himself). If you haven't found the necessary information about the book — write in the comments, we will try to find it.

How the Pentagon became the worlds largest single greenhouse gas emitter and why its not too late to break the link between national security and fossil fuel consumption.
The military has for years (unlike many politicians) acknowledged that climate change is real, creating conditions so extreme that some military officials fear future climate wars. At the same time, the U.S. Department of Defensemilitary forces and DOD agenciesis the largest single energy consumer in the United States and the worlds largest institutional greenhouse gas emitter. In this eye-opening book, Neta Crawford traces the U.S. militarys growing consumption of energy and calls for a reconceptualization of foreign policy and military doctrine. Only such a rethinking, she argues, will break the link between national security and fossil fuels.
The Pentagon, Climate Change, and War shows how the U.S. economy and military together have created a deep and long-term cycle of economic growth, fossil fuel use, and dependency. This cycle has shaped U.S. military doctrine and, over the past fifty years, has driven the mission to protect access to Persian Gulf oil. Crawford shows that even as the U.S. military acknowledged and adapted to human-caused climate change, it resisted reporting its own greenhouse gas emissions.
Examining the idea of climate change as a threat multiplier in national security, she argues that the United States faces more risk from climate change than from lost access to Persian Gulf oilor from most military conflicts. The most effective way to cut military emissions, Crawford suggests provocatively, is to rethink U.S. grand strategy, which would enable the United States to reduce the size and operations of the military.

Neta C. Crawford: author's other books


Who wrote The Pentagon, Climate Change, and War: Charting the Rise and Fall of U.S. Military Emissions? Find out the surname, the name of the author of the book and a list of all author's works by series.

The Pentagon, Climate Change, and War: Charting the Rise and Fall of U.S. Military Emissions — read online for free the complete book (whole text) full work

Below is the text of the book, divided by pages. System saving the place of the last page read, allows you to conveniently read the book "The Pentagon, Climate Change, and War: Charting the Rise and Fall of U.S. Military Emissions" online for free, without having to search again every time where you left off. Put a bookmark, and you can go to the page where you finished reading at any time.

Light

Font size:

Reset

Interval:

Bookmark:

Make
Contents
List of Tables
List of Figures
Guide
Pagebreaks of the print version
THE PENTAGON CLIMATE CHANGE AND WAR Charting the Rise and Fall of US - photo 1

THE PENTAGON, CLIMATE CHANGE, AND WAR

Charting the Rise and Fall of U.S. Military Emissions

NETA C. CRAWFORD

The MIT Press

Cambridge, Massachusetts

London, England

2022 Massachusetts Institute of Technology

All rights reserved. No part of this book may be reproduced in any form by any electronic or mechanical means (including photocopying, recording, or information storage and retrieval) without permission in writing from the publisher.

The MIT Press would like to thank the anonymous peer reviewers who provided comments on drafts of this book. The generous work of academic experts is essential for establishing the authority and quality of our publications. We acknowledge with gratitude the contributions of these otherwise uncredited readers.

Library of Congress Cataloging-in-Publication Data is available.

ISBN: 978-0-262-04748-7

d_r0

Contents

List of Figures

Overview of GHG protocol scopes and emissions across the value chain.

Map of U.S. military bases, 17761903.

The Great White Fleet departs Hampton Roads, 1907.Photo: Naval Institute Archives, December 16, 1907: The Great White Fleet Departs Hampton Roads for Circumnavigation,Naval History Blog, December 16, 2012, U.S. Naval Institute,https://www.navalhistory.org/2012/12/16/december-16-1907-the-great-white-fleet-departs-hampton-roads-for-circumnavigation.

U.S. Navy coal purchases, in tons, 18921913.

British Royal Navy coaling stations in 1914.

U.S. domestic production of refined petroleum products, military procurement, and military procurement as a percent of total production, 19391945. Military Procurement includes all military purchases of major products both in the United States and foreign countries, plus purchases made abroad for delivery to U.S. ports. Foreign purchases have been variously estimated that from one to four per cent of the total.

Comparison of physical volume of mineral production with agricultural, and industrial production and population, 19001946. Average productivity from 19351939 = 100.

Estimated effects of combined bombing on German World War II petroleum production.

U.S. Central Command.

U.S. troops deployed for Afghanistan, Operation Enduring Freedom, March 2014.

Operation Inherent Resolve air strikes in Iraq and Syria, 20142021.

U.S. arms exports, 20162020.

Institutional deep cycle: oil demand, consumption, militarization, and conflict.

Defense Logistics Agency Worldwide Locations in 2020.

DOD and Total U.S. federal government energy consumption, FY19752020, in trillions of British thermal units (BTUs).

Major categories of energy consumed by the U.S. government and DOD, FY2020 in billions of British thermal units (BTUs).

Total DOD facility energy use, billion BTUs, FY19752020, all sources.

DOD facility energy use FY19752020: coal, fuel oil, and natural gas in billions of BTUs.

DOD facilities energy consumption by major type FY2020 in billions of BTUs.

Total DOD operational fuel consumption and expenditures, FY20072020.

Operational energy demand, millions of barrels, FY20072020.

DOD vehicle fuel consumption in millions of gallons, by major fuels, FY19752020. The U.S. military halted use of Navy Special Fuel for ships in 2010. The U.S. Air Force and Army use JP-8 fuel; the navy uses JP-5 fuel. Commercial fuel has been certified for military jets since 2014. Military vehicles also used 593 million gallons of aviation gas and 14 million gallons of liquid propane gas/propane from FY19752020. There were also 77,620 BTUs generated for vehicles by other unspecified means.

Operational energy use by service, domain, and mission, FY2014.

Estimated and reported DOD greenhouse gas emissions, million metric tons of COe, FY19752020.

Military jet fuel and diesel emissions, 19902020, million metric tons of CO

Greenhouse gas emissions of fuel oil, natural gas, and coal at military facilities, 19752020 in metric tons, CO

Total Scope 1 and 2 metric tons of COe emissions of Lockheed Martin, Northrop Grumman, and General Dynamics, 20102020.

The petroleum target system.

Attacks on NATO supply convoys through Pakistan, 20082014.

Outages lasting eight or more hours at DOD installations caused by acts of nature.

U.S. military assets with climate-related vulnerabilities.

U.S. installation at Diego Garcia.

DOD map of representative climate change hazards and potential impacts, 2021.

National Intelligence Council map of vulnerable countries, 2021.

DOD electric and non-electric renewable energy sources, millions of BTUs, FY20102020.

Alternative energy production and purchases at DOD installations in FY2016.

Flooding at Offutt Air Force Base on March 17, 2019.

U.S. Navy presence in 2021, carrier strike groups and expeditionary strike groups.

Average daily U.S. petroleum exports and imports, 19602020.

Fossil fuel and renewable energy consumption in the United States, 19752020.

Biomass, hydropower, geothermal, solar, and wind energy consumption in the US, 20002020.

The deep cycle.

Department of Energy research and development funding, energy technology share of funding, 19782018.

U.S. annual COemissions, 18452019.

DOD annual base and overseas contingency operations war spending, FY2001FY2022 in current dollars. FY2001FY2021 is the authorized amount. FY2022 is the request.

U.S. and Chinese military spending, 19902020 in constant (2019) U.S. dollars.

U.S. defense suppliers earnings before interest, tax, depreciation, and amortization, FY2014 FY2019.

U.S. military spending, in constant 2019 dollars and BTUs per fiscal year.

Estimate of DOD standard and nonstandard greenhouse gas emissions, millions of metric tons COe, FY20002020.

List of Tables

DOD scope 1 and 2 emissions, COe, for fiscal years 20102019

Comparison of COe emissions of the U.S. militaryrelated emissions with selected country COemissions in 2019

Characteristics of mid-nineteenth-century U.S. naval steamers

U.S. production of 100-octane aviation gasoline, 19411945, thousands of barrels

U.S. bases in Middle East and Persian Gulf region, September 2021

Fuel energy content

Data from Table 1.A.5 Other and Table 1.D International Aviation and International Navigation (International Bunkers) and multilateral operations of the 2021 U.S. common reporting format (CRF), emissions data for mobile military emissions

Next page
Light

Font size:

Reset

Interval:

Bookmark:

Make

Similar books «The Pentagon, Climate Change, and War: Charting the Rise and Fall of U.S. Military Emissions»

Look at similar books to The Pentagon, Climate Change, and War: Charting the Rise and Fall of U.S. Military Emissions. We have selected literature similar in name and meaning in the hope of providing readers with more options to find new, interesting, not yet read works.


Reviews about «The Pentagon, Climate Change, and War: Charting the Rise and Fall of U.S. Military Emissions»

Discussion, reviews of the book The Pentagon, Climate Change, and War: Charting the Rise and Fall of U.S. Military Emissions and just readers' own opinions. Leave your comments, write what you think about the work, its meaning or the main characters. Specify what exactly you liked and what you didn't like, and why you think so.