Contents
List of Figures
List of Tables
Guide
Pagebreaks of the print version
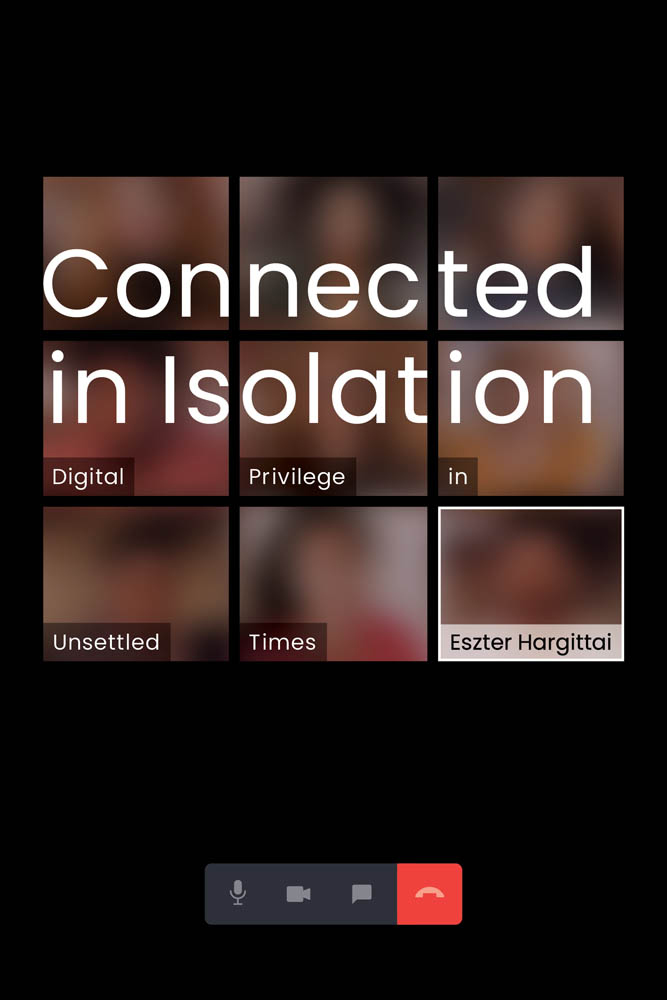
CONNECTED IN ISOLATION
DIGITAL PRIVILEGE IN UNSETTLED TIMES
ESZTER HARGITTAI
The MIT Press
Cambridge, Massachusetts
London, England
2022 Massachusetts Institute of Technology
All rights reserved. No part of this book may be reproduced in any form by any electronic or mechanical means (including photocopying, recording, or information storage and retrieval) without permission in writing from the publisher.
The MIT Press would like to thank the anonymous peer reviewers who provided comments on drafts of this book. The generous work of academic experts is essential for establishing the authority and quality of our publications. We acknowledge with gratitude the contributions of these otherwise uncredited readers.
Library of Congress Cataloging-in-Publication Data
Names: Hargittai, Eszter, 1973 author.
Title: Connected in isolation : digital privilege in unsettled times / Eszter Hargittai.
Description: Cambridge, Massachusetts : The MIT Press, [2022] | Includes bibliographical references and index.
Identifiers: LCCN 2022005156 (print) | LCCN 2022005157 (ebook) | ISBN 9780262047371 (paperback) | ISBN 9780262371490 (pdf) | ISBN 9780262371506 (epub)
Subjects: LCSH: Digital divide. | Digital media. | Information societySocial aspects. | Covid-19 (Disease)Social aspects.
Classification: LCC HM851 .H3665 2022 (print) | LCC HM851 (ebook) | DDC 303.48/33dc23/eng/20220207
LC record available at https://lccn.loc.gov/2022005156
LC ebook record available at https://lccn.loc.gov/2022005157
d_r0
To my mother, Dr. Magdolna Hargittai, for introducing me to the Internet in 1992, and for so much more.
CONTENTS
LIST OF ILLUSTRATIONS
The theory of digital inequality: the process by which differences in social position translate into varied digital contexts, which influence online behavior and may result in divergent life outcomes.
Percentage of respondents who reported having left their home for various essential and nonessential activities a few weeks into lockdown measures in the three countries.
Percentage of people worrying about various issues since the novel coronavirus outbreak in the three countries.
Percentage of people with positive home experiences due to the pandemic in the three countries, separated out by whether there were children in the household.
Percentage of people with negative home experiences due to the pandemic in the three countries, separated out by whether there were children in the household.
Percentage of people with certain types of home childcare experiences due to the pandemic in the three countries, separated out by whether there were children in the household.
Percentage of respondents who chose the correct responses to multiple-choice questions about COVID-19 in the three countries.
Percentage of people who correctly identified in a true-or-false question the ways to reduce COVID-19 infection with the largest portion of the pie indicating those who correctly identified all possible ways and smaller pie segments depicting decreasing numbers of correct answers.
Distribution of how many COVID-19 knowledge items people answered correctly in the three countries by percentage.
Percentage of people who held different numbers of misbeliefs about the pandemic in the three countries. The zero category on the left of each bar indicates those who indicated no misconceptions about COVID-19.
Tweet by Monterey County California Supervisor Luis Alejo about school children using Taco Bells Wi-Fi to do their schoolwork. Tweet with name reprinted with permission. (Photo by Olga Guzman.)
Percentage of respondents who only go online once a day or less by autonomy of use (number of devices).
Internet skills distribution in the three countries (U.S. = dashed; Italy = gray; Switzerland = dotted) with a normal distribution curve in black as reference.
Average general Internet skills by age groups across the three countries.
Average social media skills by age decades across the three countries.
Percentage of people who needed help with technology (dark bar) and percent of just these people needing help who had those needs met (light bar) by age group.
Percentage of people who had questions about or had run into problems with various technology-related activities during the first six weeks of the Coronavirus pandemic.
Tweet by user @llcooljackie expressing frustration over difficulty with obtaining needed information in light of website with template content (something, something, something) instead of needed information about home medical equipment. Tweet with name reprinted with permission.
Percentage of respondents who use each social media platform daily (dark gray) and at all (light gray) in each of the three countries. (Reddit was not included on the Switzerland survey due to its low prevalence there.)
The relative popularity of various types of pandemic-related content people saw (full bar) and shared (dark part of the bar) on social media in the United States in descending order of popularity.
The relative popularity of various types of pandemic-related content people saw (full bar) and shared (dark part of the bar) on social media in Italy in descending order of popularity.
The relative popularity of various types of pandemic-related content people saw (full bar) and shared (dark part of the bar) on social media in Switzerland in descending order of popularity.
Percentage of respondents who participated in pandemic-related discussions and who asked for/offered/received support on social media in the three countries.
Level of social connectedness (y-axis, 15-point scale) between those who did not engage on social media about the pandemic (light left bars) by way of general interactions as well as support and those who did (darker right bars), across the three countries. The lighter shades for discussion in Italy signal lack of statistical significance in difference.
The difference in COVID-19 knowledge score between those who had actively engaged on social media about the pandemic and those who had not in the three countries. Active engagement is related to lower levels of pandemic knowledge.
Difference in misinformation beliefs about COVID-19 between those who had actively engaged on social media about the pandemic and those who had not in the three countries. In all cases, active engagement is related to holding more misconceptions about the virus.
How closely people followed news about the novel coronavirus outbreak in the three countries.
Peoples knowledge about COVID-19 by following pandemic news very closely (darker left columns) versus less so (lighter right columns) by country.
The relative popularity of media types as information sources about the pandemic across the three countries.
Information sources about the pandemic among respondents in the United States grouped by media type: TV, websites, social media, paper, and radio; darker part of the line refers to a source consulted daily or almost daily, and the lighter part to a few times a week or less.
Information sources about the pandemic among respondents in Italy grouped by media type: TV, websites, social media, paper, and radio; darker part of the line refers to a source consulted daily or almost daily, and the lighter part to a few times a week or less.


