Answers to Selected Short-answer Questions
Chapter 1 Basic Acoustics and Acoustic Filters
2

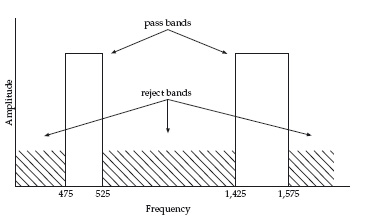
7 The pass bands and reject bands of this double pass filter are shown in
Pass bands and reject bands of the filter described in question 7 of chapter 1.
Chapter 2 The Acoustic Theory of Speech Production
1 Amplitude at

The spectrum seems to be tilted so that the amplitude goes down by 3 dB over this frequency interval.
3 Using formula:
Table A1 Formant frequencies in (Hz) of vocal tracts of 12, 15, and 18. End-corrected formants L = L + 1.2 are shown in parentheses.

Chapter 3 Digital Signal Processing
2 Nyquist frequencies are:
8,000 Hz, 5501.25 Hz, 10 Hz
5 Because the ideal lag duration in autocorrelation pitch tracking is the real pitch period of signal (which is what we are doing in pitch tracking) the best lag durations are 1/F0
1/100 = 0.01 sec, 1/200 = 0.005 sec, 1/204 = 0.0049 sec
8 The window is: 512/22,000 (0.02327) seconds. Actually, the terms 22 k or 22 kHz sampling almost always refer to a 22,050 Hz sampling rate which would alter this answers a bit.
9 22,000 samples per second multiplied by 0.02 seconds equals 440 samples.
10 The interval between points in the FFT spectrum is 21.53 Hz. This is derived by dividing the Nyquist frequency, i.e. one-half of the sampling rate (well assume 11,025 Hz), by 256 ( of the FFT window the other half codes the imaginary part of the spectrum).
Chapter 4 Basic Audition
1 Six sones = 50,000 Pa. Subjectively double is 12 sones, which equals 137,000 Pa. This sound, which is subjectively twice as loud, has a sound pressure level that is almost three times greater.
3

Chapter 5 Speech Perception
4 With the submatrix for [d] and []
we can calculate similarity (S),
Sd = (0.0 + 0.015)/(0.727 + 0.515) = 0.0124
and then distance (d),
which is greater than the distance between [z] and [].
5 The data on how auditory and visual perceptual spaces combine to let us predict the audio/visual McGurk effect are clearly compatible with the view that listeners perceive speech gestures conveyed by both audition and vision. Of course, compatibility doesnt equal proof, but scientists do tend to accept the theory that is compatible with the widest range of available data.
Chapter 6 Vowels
2 Using equation (6.2) with Ab = 3, lb = 4, and lc = 2 we have Ablblc = 24 and c/2 = 5,570.4. Thus, for values of Ac between 0.05 and 2 we have:
When Ac equals 0, F1 also equals 0.
6 For the mid and low vowels in Mazatec we can see a peak for the second harmonic between the F0 (first harmonic) and F1 peaks. Unlike the LPC spectra in the lowest vocal tract resonance (F1) may be the second or third peak in the spectrum. With a high-pitched voice we might even find that F0 and F1 form a single peak in the auditory spectrum. So it would seem that if F1 can be the first, second, or third peak it would be difficult to devise an automatic formant tracker for F1 in auditory spectra.
Chapter 7 Fricatives
2 As the articulators come together at the beginning of a fricative, and as the constriction is released at the end of a fricative, the assumption that the front and back cavities are uncoupled is likely to be wrong. This is because the constriction is less narrow at these times. Thus, at fricative onset and offset we might expect to see spectral peaks at the resonant frequencies of the back cavity.
4 This question is mysterious to some students. Acoustic coupling is the key. When the front and back cavities are strongly coupled (as in vowels) their resonances merge to form stable regions. But when the front and back cavities are not strongly coupled (as in fricatives) the front cavity resonances skip the back cavity resonances (). So, if quantal regions define distinctive features, and if, as the figures imply, quantal regions for fricatives and vowel place of articulation differ, then vowel and fricative place features must be different. This falls under a general observation that acoustic considerations tend to lead us to conclude that vowels and consonants have different features, while articulatory considerations lead us to conclude that vowels and consonants can be described with the same features.
Chapter 8 Stops and Affricates
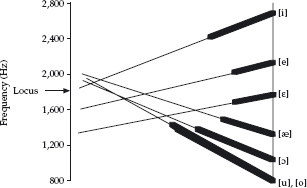
2 . The vertical line-up point is the onset of the vowel steady-state for each of the dV syllables in that figure. The heavy lines show the formant transitions and the light lines show these extended back so that they intersect with each other. I chose the locus frequency giving greater weight to the longer, easier-to-measure transitions of [u] and [i].
The F2 locus frequency of [d].
4 Yes, affricates do have stop release bursts. Because they have a stop component, it stands to reason that the same pressure buildup and release that we see in nonaffricated stops would also be present in affricates. However, affricate release bursts might be auditorily masked by the sudden onset of frica-tion that occurs soon after stop release.
Chapter 9 Nasals and Laterals
1 The light damping peak in has a steeper skirt. Energy falls off more gradually from the heavy damping peak than from the light damping peak.
3 Assume that the mouth cavity is 4 cm long in a palatal nasal. Then the lowest anti-formant frequency is:
5 What breathy vowels and nasalized vowels have in common is that they both have increased energy at low frequencies, as compared with the spectra of non-nasalized modal vowels. The voice spectrum in breathy vowels has a steeper spectral slope, and thus relatively more low-frequency energy. In nasalized vowels there are two low-frequency resonances (the nasal and oral first formants), and the anti-formants in nasalized vowels attenuate higher-frequency energy in the spectrum.
So spontaneous nasalization may result from a perceptual confusion in which listeners hearing breathy vowels may falsely think that the speaker is producing a nasalized vowel. If nasalized vowels occur only in the context of a nasal consonant, the listener may then parse the mistakenly identified nasalized vowel as a vowelnasal sequence comparable to other nasalized vowels in the language.


