Contents
Guide
Michael C. Thomsett
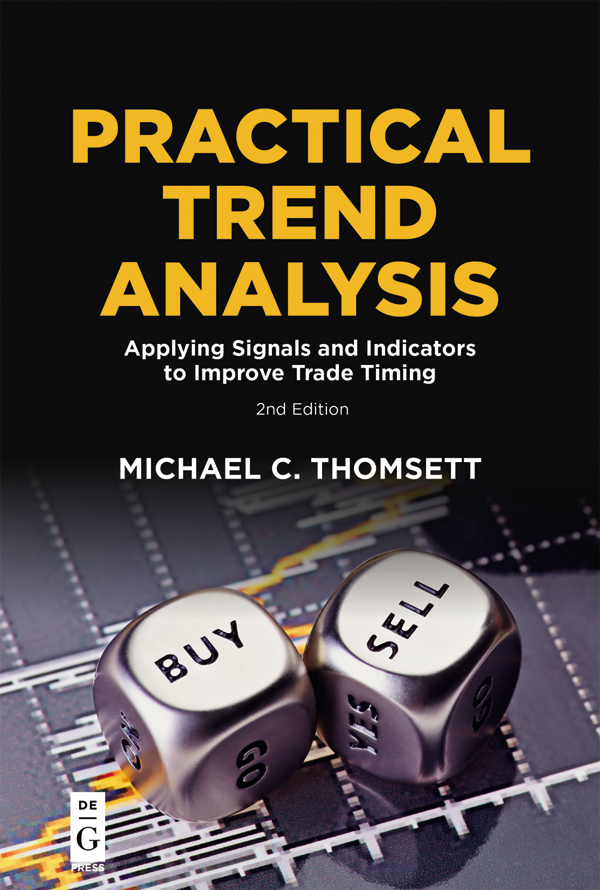
Practical Trend Analysis
ISBN 978-1-5474-1721-6
e-ISBN (PDF) 978-1-5474-0108-6
e-ISBN (EPUB) 978-1-5474-0110-9
Library of Congress Control Number: 2018962686
Bibliographic information published by the Deutsche Nationalbibliothek
The Deutsche Nationalbibliothek lists this publication in the Deutsche Nationalbibliografie; detailed bibliographic data are available on the Internet at http://dnb.dnb.de.
2019 Michael C. Thomsett
Published by Walter de Gruyter Inc., Boston/Berlin
Cover Image: Sergey_P/iStock/Getty Images Plus
www.degruyter.com
Introduction to the Second Edition:
The Basic Problem with Numbers
In the first edition of this book, the purpose was to fill in the many gaps discovered in the literature about stock market trends.
This book is intended as a serious study of trends for experienced investors and traders. These individuals know how trends behave but also need to solidify their analytical tools for trend analysis. There are no simple answers to predicting trend direction, strength, or duration. However, specific tools technicians favor can be used in combination to anticipate trend reversal or continuation, and to confirm those moves.
Many books have been written on this topic; however, most are outdated and do not provide readers with a practical view of how trends work and how they can be studied. The best known book on the topic was first published in 1948, and in the new edition, the charts are seventy years out of date and limited to line charts; there are no candlestick charts in the book (although, ironically, the cover art shows a representation of candlestick patterns). One chart compares industrial to rails, an old term for what today is called the transportation average.
The purpose here is not to criticize other published books, but to point out the lack of practical and actionable information about trends. No other book truly addresses the methods of technical analysis needed to properly understand short-term and long-term trends and how to determine whether they will continue or reverse. Most books do not address the third type of trend (beyond bullish and bearish), the sideways-moving trend or consolidation . Many books refer to this as continuation, which is an error of definition.
These and other issues led to the publication of this books first and updated editions, with added emphasis in the many areas useful to traders. The trend, after all, is supposed to be somewhat predictable. Traders employing all the technical tools can improve timing of entry and exit of their trades and overcome the elusive and often mysterious unpredictability of market prices.
Price movement is not as unpredictable as many believe; it is only a matter of traders uncertainty about how to read the signals and how to move confidence as close as possible to 100 percent so that trades can be timed expertly.
Getting to 100 percent is impossible because even the strongest signals will fail or mislead at times. The purpose of trend analysis is not to become perfect in timing the market, but to improve the percentages of being correct versus being wrong, or settle for 50/50.
Contrary to the pessimistic conclusions of some market theories (efficient market hypothesis and random walk hypothesis), it is possible to predict price movement. One goal of this book is to convince the reader that it is possible (very possible) to profit in the market with improved timing. It comes down to how you define the market.
Many will say the market is efficient or random, or both. Is this a fair definition of the market? No. Many technical tools offer powerful predictive qualities and enable you to improve well above the 50/50 guess many claim defines the market. The claim to efficiency or randomness (usually made by those who do not trade in the real-world of the market) is demonstrably false and unsupportable.
Experienced professional traders realize that the market is neither efficient nor random. Even the Dow theory, the basis of traditional technical analysis, does not agree on identification of changes in primary trends. The meaning of trends is debated endlessly among technicians. Is a change in direction a new primary trend, a secondary trend, or merely a retracement? The debate is ceaseless and there appears to be more disagreement than agreement on the basic question of how trends behave.
In this uncertain trading environment, how do professional traders manage effectively? This edition offers methods of trend analysis based on a few sound principles. These include the essential observation of the trading range; reversal, continuation, and consolidation; confirmation methods; gaps; and non-price signals confirming or forecasting changes in the current trend.
Every experienced trader who relies on a short list of reversal and continuation signals, who understands how chart analysis is performed, and wants to recognize changes in the price pattern, already understands how uncertain a trend can be, and how difficult it is to quantify signals in the moment. Every trader deals with conflicting and contradictory signals, and may easily overlook the larger picture of movement in the trend.
These movements may be simplified and classified as reversal, continuation, or consolidation. However, this identification is never 100 percent clear or precise. Experienced traders may not be certain about the current status of individual stock trends even with an advanced level of knowledge. And those who do know also understand that the current status of a trend is likely to change at any moment. A trend in an individual stock is likely to be easier to track and predict than a trend in an index. The index contains many different stocks, so the trend is itself the sum of net increases and decreases in price levels for all the components. Furthermore, the index itself, such as the Dow Jones Industrial Averagethe favorite gauge of the marketmay be weighted so that a few stocks account for a large portion of a total trend movement. This makes trends of indexes less certain. Even though many stocks track the market closely, this book focuses on individual stock trends . In these cases, it is more reliable to associate trend activity with both fundamental and technical causes and responses.
The many charts representing price patterns and trends are based primarily on the period between 2012 and 2016. During this period, the market did not trend strongly so that the stock charts were easy to track. Between 2016 and 2018, however, the overall market moved into a strong bullish trend. The Dow Jones Industrial Average moved 7,000 points in less than two years following the 2016 election. Because so many stocks followed this trend, most charts were bullish. This meant that demonstrating trend characteristics was less varied than during more typical, slower-trending markets. As a result, the charts in this book are outdated on purpose, but the visual summaries they provide are relevant to trend analysis. Using historical rather than current charts also adds the clarity of hindsight, enabling an analyst to better understand what went on and how trends and prices behaved during a past period.
The first chapter reviews the basic theories about trends and examines whether or not those theories offer reliable intelligence traders can use to time entry or exit. expands on the discussion with a study of trendlines and channel lines.

