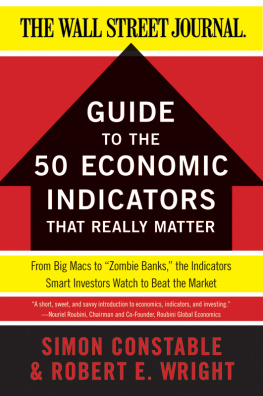
THE WALL STREET JOURNAL GUIDE TO
The 50 Economic Indicators
That Really Matter
From Big Macs To Zombie Banks, the Indicators
Smart Investors Watch to Beat the Market
Simon Constable
and
Robert E. Wright

Contents
THIS BOOK IS ABOUT economic indicators. It must beit says so on the cover! But its more than that. Its about helping you protect your money. No matter how much or how little that is, you deserve to keep it and, with a little luck and a lot of savvy, see it grow. The best way to do that, we think, is to watch trends in data. Not just a few key metrics followed by everyone (yes, those too) but a whole slew of them, many of which most people have never heard of. We think to really have an edge, investors need to get creative, maybe even a little wacky, and look at the economy not just outside the box but inside the diner, the fast-food restaurant, and out on the street. Youll see what we mean by that later on, near the end of the book.
Anyone with any investment portfolio whatsoever knew pain when the Great Credit Crunch hurled stock markets into turmoil in 2008 and into 2009. Investors large and small watched while their wealth shrank by the day, and sometimes even by the hour.
This book is about you not letting that happen again. To achieve that well show you how the economic indicators weve chosen can help you see the turns in the economy before they happen. With that prescience you can then make changes to your investments ahead of time and avoid the suffering you probably felt during the past couple of years.
Protecting ones nest egg in this way is crucial to investing success. After all, what is the sense of beating the market for five, ten, or twenty years only to have the market beat you senseless in a financial crash? And after the ugliness is over, will you have the foresight and the guts to jump back in while the getting is still good? The financial crisis of 20089 and its aftermath suggest that most investors were insufficiently nimble because they were looking at what the economy was rather than what it would become.
While collectively these investors lost trillions of dollars, the problem is that many appear to be no wiser about the economy or investing than they were before the crisis. They seem destined to play it too safe when they should be making risky trades, and making risky investments when they should be playing it safe. In essence they will buy high then sell low, and then eventually buy back high again. That is the exact opposite of a profitable investment strategy.
Such an unhappy outlook for investors will remain the sameunless, that is, they digest the lessons of this book, which aims to teach investors how to invest across the business cycle, not just when prices are rising. In other words, this book intends to provide investors with sophisticated ways of thinking about the economy, not to lead them by the nose to specific investments. You know the parable about how giving a man a fish only feeds him for a day, but teaching him how to fish feeds him for a lifetime? The same goes for investing.
Use the Clues
Discerning the economys directionwhether it will soar, plummet, or stagnatemay sound difficult, and it certainly isnt easy, but the economy cant help but constantly provide statistical clues about its health. Those clues can be seen using economic indicators. Some, called leading indicators, point to where the economy is heading. Others, called coincident, provide clues about its current position. Yet others, so-called lagging indicators, tell us where the economy has been. Leading indicators provide the most obvious basis for profit-making ideas, but concurrent and lagging indicators are important, too.
In case you havent sensed it yet, at the points at which we discuss specific investment strategies and not just simple economics, we think mostly about intermediate and long-term investing, not day trading, foreign exchange dealing, derivatives swapping, or other forms of short-term speculation. That sort of stuff is best left to technical analysts, computers, and large sophisticated players.
Who we can help are people who want to use economic data and indicators to discern what is actually going to happen to the economy next month or next year and invest accordingly now to reap gains later.
If you look around enough bookstores, youre bound to encounter other books on economic indicators, including one that purports to unlock their secret clues and at least one that explicitly aims to help people with below-average intelligence understand some of the most complex concepts known to humanity.
We make neither claim. This book is certainly not for novices, but at the same time you dont have to already have a PhD in economics to understand it. It also contains no secrets.
The information contained in this book, though often obscure to some people, is mostly readily available. All we have done is to find, compile, and explain it in what we hope readers will find a succinct and entertaining way.
We also believe that people have to do at least some research and forecasting on their own. A wet-behind-the-ears beginner cant tell the difference between a true expert, a quack, and a knave. So it is important to develop some expertise of your own.
The Fantastic 50
When we decided to put together a list of indicators to help readers understand what was going on in the economy we wanted to develop one that covered the entire economy. We also decided to exclude some of the big indicators that youve likely heard of. So you wont find the CPI (the Consumer Price Index measure of price inflation) in our list because even those with just a casual interest in the economy have heard of that common measure of inflation. Knowing what everyone else knows will not put you ahead of the pack.
Instead you need to look beyond the obvious. Thats why our list is mostly well off the beaten track. The indicators included can help you understand where inflation (and not just consumer prices), GDP (gross domestic product, the measure of the entire output of goods and ser vices in the economy), and (un)employment are going nextbut before they go there.
If fifty sounds daunting, keep in mind that the economy is a shape-shifting beast best examined from many angles and multiple perspectives. Some perspectives are more important than others, but all help to provide a more nuanced and textured portrait of the business cycle. And you really do need a sophisticated portrait of the economy because there is no one-size-fits-all indicator.
Many indicators move wildly up and down from month to month for random reasons, such as a freak storm or a fluke order. Moreover, due to pressure to put numbers out quickly, many indicators are merely guesstimates that will be revised later, sometimes drastically. Finally, many indicators, like house sales, have to be seasonally adjusted. Adjustment techniques, however, are far from foolproof and may over- or undercompensate for seasonal fluctuations.
Analyzing a selection of carefully chosen indicators is a better way of sorting out whats known as statistical noise. The intuition behind our view that many indicators should be consulted is simple: the more indicators that point in the same direction, the more likely they are pointing to a real economic phenomenon and not a random or seasonal change. We consider the indicators we chose to be the best based on four simple criteria:
Timeliness: If the information is stale before it is available, why bother?
Accuracy: If the data is unreliable or is frequently revised, why bother?
Next page
