• Complain

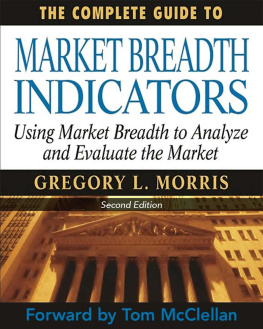
Gregory Morris (Author) - The Complete Guide to Market Breadth Indicators: How to Analyze and Evaluate Market Direction and Strength

Here you can read online Gregory Morris (Author) - The Complete Guide to Market Breadth Indicators: How to Analyze and Evaluate Market Direction and Strength full text of the book (entire story) in english for free. Download pdf and epub, get meaning, cover and reviews about this ebook. year: 2015, publisher: Gregory L. Morris, genre: Business. Description of the work, (preface) as well as reviews are available. Best literature library LitArk.com created for fans of good reading and offers a wide selection of genres:

Romance novel Science fiction Adventure Detective Science History Home and family Prose Art Politics Computer Non-fiction Religion Business Children Humor

Choose a favorite category and find really read worthwhile books. Enjoy immersion in the world of imagination, feel the emotions of the characters or learn something new for yourself, make an fascinating discovery.

Gregory Morris (Author) The Complete Guide to Market Breadth Indicators: How to Analyze and Evaluate Market Direction and Strength

The Complete Guide to Market Breadth Indicators: How to Analyze and Evaluate Market Direction and Strength: summary, description and annotation

We offer to read an annotation, description, summary or preface (depends on what the author of the book "The Complete Guide to Market Breadth Indicators: How to Analyze and Evaluate Market Direction and Strength" wrote himself). If you haven't found the necessary information about the book — write in the comments, we will try to find it.

Breadth analysis is one of the purest measures of market liquidity. Applicable to virtually any exchange or index of securities for which breadth data is available, it represents the best available footprint of the health and near-term direction of the overall market examined. The Complete Guide to Market Breadth Indicators is the first book to delve into the use, mathematics, and interpretation of the most popular and proven of these tools, and is an invaluable reference for technical traders and investors of all types, and in every market.Market breadth indicators, i.e. advance/decline, new highs/new lows, or up/down volume, allow the technical analysts and traders to look beneath the surface of a market to quantify the underlying strength or direction associated with a market move. Increasingly popular in all types of markets, these indicators give traders the ability to accurately forecast a number of possible outcomes and the likelihood of each.Bottom line? For gauging the near-term direction and strength of a market, breadth indicators are among the single most valuable tools a trader can use.The Complete Guide to Market Breadth Indicators is the most compreshensive and vivid collection available of market breadth indicator information and features ideas and insights from market verterans including Tom and Sherman McClellan, John McGinley, Jim Miekka, and numerous others. Chapters are first categorized based on the mathematical relationship between the breadth pairs such as advances and declines. Each indicator is then analyzed to provide information including:Also know as - other names by which the indicator is recognized.Author/creator - when available.Data components required - components of breadth data required to calculate the indicator.Description - brief description of the indicator.Interpretation - generally accepted industry interpretation of the indicator, with techniques of different analysts also discussed.Chart - or charts that best display the indicator, all provided by StockCharts.com.Author Comments - Greg Morriss personal interpretation, opinion, and use of the indicator, along with suggested modifications, complementary indicators, and more.Formula - An algebraic formula for the indicator or, for formulae that are too complex for this section, a descriptive narrative on the formula.StockCharts.com Symbol - the symbol of the indicators for use on StockCharts.com.References - An indicator-specific bibliography for additional information on the indicator or its creator, with notes about a particular book or magazine article.

Gregory Morris (Author): author's other books


Who wrote The Complete Guide to Market Breadth Indicators: How to Analyze and Evaluate Market Direction and Strength? Find out the surname, the name of the author of the book and a list of all author's works by series.

The Complete Guide to Market Breadth Indicators: How to Analyze and Evaluate Market Direction and Strength — read online for free the complete book (whole text) full work

Below is the text of the book, divided by pages. System saving the place of the last page read, allows you to conveniently read the book "The Complete Guide to Market Breadth Indicators: How to Analyze and Evaluate Market Direction and Strength" online for free, without having to search again every time where you left off. Put a bookmark, and you can go to the page where you finished reading at any time.

Light

Font size:

Reset

Interval:

Bookmark:

Make

The Complete Guide to Market Breadth Indicators

by Gregory L. Morris


2015 Gregory L. Morris


Dedicated to Laura

Table of Contents

Technical Analysis

Technical Indicators

A Familiar Breadth Indicator

Breadth Relationships

The Breadth Dance

Breadth Components

Breadth versus Price

The Difference between Daily and Weekly Breadth Data.

Advantages and Disadvantages of using Breadth

Indicators and Terminology You Should Be Familiar With

About the Charts in this Book

Multicollinearity

Individual Breadth Indicator Format

Chapter Format

Indicator Categories

General Advance and Decline Information

General New High and New Low Information

General Up Volume and Down Volume Information

Complete List of Breadth Indicators

Thoughts on the Continuing Validity of the A-D Line

The Relationship between an Exponential Oscillator and its Summation Index

The McClellan Oscillator and Summation Index

McClellan Summation Index Buy Signal

Percent Above Moving Average

Bullish Percent

Participation Index

A Few Breadth Indicators Using Common Stocks Only

Favorite Breadth Indicators

McClellan Summation Index for Big Picture of the Market

Breadth Consensus Index

List of Charts, Tables, Figures

Chart 1-1-Advances, Declines, and Unchanged, all as a percentage of total issues

Chart 1-2 New Highs and New Lows as a percentage of total issues

Chart 1-3 Up Volume and Down Volume as a percentage of total issues

Chart 3-1-Advances and Declines

Chart 3-2 Advances and Declines adjusted for Total Issues

Chart 3-3 New Highs and New Lows

Chart 3-4 New Highs and New Lows adjusted for Total Issues

Chart 3-5 Up Volume and Down Volume

Chart 3-5b Up Volume and Down Volume plotted using semi-log scaling

Chart 3-6 Up Volume and Down Volume adjusted for Total Volume

Chart 4-1-Advances minus Declines smoothed by 21-days

Chart 4-2 Advances minus Declines exponentially smoothed by 3 days

Chart 4-2b Advances minus Declines exponentially smoothed by 3 days with +1000-and -1000-zones

Chart 4-3 Advance Decline 10-and 30-smoothed difference - Mamis

Chart 4-4 Advance Decline Overbought Oversold

Chart 4-5 Advance Decline Overbought Oversold with levels at +400, +150, -150, and -400

Chart 4-6 Advance Decline technique - Lindsay

Chart 4-7 Advance Decline - Kinsman

Chart 4-8 Plurality Index

Chart 4-9 Plurality Index with new zones

Chart 4-10-Fugler 3-day Advance Decline technique

Chart 4-11-Advance Decline Line

Chart 4-12 Advance Decline Line non confirmation - 1987

Chart 4-13 Advance Decline Line non confirmation - 1998

Chart 4-14 Advance Decline Line divergences

Chart 4-15 Advance Decline Line - weekly

Chart 4-16 Momentum Index - Weinstein

Chart 4-17 1% Advance Decline - Swenlin

Chart 4-18 Eakle Advance Decline Index

Chart 4-19 Eakle Advance Decline Index - weekly

Chart 4-20-Advance Decline Line Normalized 5 days

Chart 4-21-Advance Decline Line Normalized - 21-days

Chart 4-22 Bolton Advance Decline Line

Chart 4-23 Bolton Advance Decline ratio - 21-day smooth

Chart 4-24 Advance Decline Line adjusted for total issues

Chart 4-25 Big Movers Only - 35%

Chart 4-26 Big Movers Only - 50%

Chart 4-27 Advance Decline Line Oscillator

Chart 4-28 Advance Decline Line Oscillator - Appel

Chart 4-29 Absolute Breadth Index - 50-day smooth

Chart 4-30-Absolute Breadth Index - 21-day smooth with 300-and 1100-levels

Chart 4-31-Absolute Breadth Index - 21-day with 250-and 600-levels

Chart 4-32 Absolute Breadth Index Adjusted by Total Issues - 21-day smooth with 10-and 30-levels

Chart 4-33 McGinley Advance Decline (AD) Power

Chart 4-33b Weekly McGinley AD Power

Chart 4-34 Coppock Breadth Indicator

Chart 4-35 Haurlan Index Short-term

Chart 4-36 Haurlan Index Intermediate-term

Chart 4-37 Haurlan Index Long-term

Chart 4-38 McClellan Oscillator

Chart 4-39 McClellan Summation Index - Traditional

Chart 4-40-McClellan Summation Index - Miekka

Chart 4-41-McClellan Summation Index - Swenlin

Chart 4-42 McClellan Summation Index - Pring

Chart 4-43 Merriman NYSE Breadth Model

Chart 4-44 Swenlin IT Breadth Momentum Oscillator

Chart 4-45 Swenlin Trading Oscillator Breadth

Chart 4-46 Zahorchak Method - daily

Chart 4-47 Zahorchak Method weekly

Chart 4-48 Zahorchak Alternate daily

Chart 4-49 Zahorchak Alternate weekly

Chart 4-50-Zahorchak Alternate special - weekly

Chart 5-1-Advance Decline Ratio 1965 - 2004

Chart 5-2 Advance Decline Ratio 1996 - 2004

Chart 5-3 Breadth Thrust

Chart 5-4 Breadth Thrust with simple 10-day smooth

Chart 5-5 Breadth Thrust with exponential 8-day smooth

Chart 5-6 Breadth Thrust Continuation

Chart 5-7 Duarte Market Thrust - weekly

Chart 5-8 Eliades Sign of the Bear

Chart 5-9 Hughes Breadth Momentum Oscillator

Chart 5-10-Hughes Breadth Momentum % Oscillator

Chart 5-11-Panic Thrust

Chart 5-12 STIX Short-Term Trading Index

Chart 5-13 STIX with 10-day smooth

Chart 6-1-Schultz Advances / Issues Traded Ratio

Chart 6-2 Schultz Advance / Total Issues - smoothed

Chart 6-3 Advance Decline Divergence Oscillator

Chart 6-4 Advance Decline Diffusion Index

Chart 6-5 Breadth Climax

Chart 6-6 Declining Issues TRIX

Chart 6-7 Advancing Issues TRIX

Chart 6-8 Disparity between NYSE Index and Advance Decline Line

Chart 6-9 Disparity Index

Chart 6-10-Walter Heiby Dynamic Synthesis

Chart 6-11-Walter Heiby Dynamic Synthesis as a percentage of Total Issues

Chart 6-12 Walter Heiby Dynamic Synthesis Indicator

Chart 6-13 Unchanged Issues

Chart 6-14 Unchanged Issues 21-day smooth

Chart 6-15 Unchanged Issues as a percentage of Total Issues

Chart 6-15b Unchanged Issues / Total Issues - 1987

Chart 6-16 Velocity Index

Chart 7-1-New Highs New Lows 21-day smooth

Chart 7-2 New Highs New Lows % Total Issues - Hayes

Chart 7-3 New Highs New Lows Line

Chart 7-4 New Highs New Lows Line 21day smooth

Chart 7-5 New Highs & New Lows Oscillator

Chart 7-6 New Highs & New Lows Oscillator - Appel

Chart 7-7 New Highs New Lows - Morris

Chart 7-8 High Low RSI

Chart 7-9 High Low Stochastic

Chart 7-10-New Highs New Lows Ratio 21-day smooth

Chart 7-11-New Highs New Lows Ratio 10-day smooth

Chart 7-12 New High New Low - Cohen

Chart 7-13 New Highs New Lows Ratio - Merrill

Chart 7-14 Weekly New Highs - Hayes

Chart 7-15 New Highs - Hayes

Chart 7-16 New Highs & New Lows Cross

Chart 7-17 New High New Low Cross 10-day smooth

Chart 7-18 New Highs New Lows - Burk

Chart 7-19 New Highs % Total Issues

Chart 7-20-New Highs % Total Issues Rate of Change

Chart 7-21-Weekly New Highs New Lows - Hayes

Chart 7-22 New Lows % Total Issues

Chart 7-23 New Lows % Total Issues Rate of Change

Chart 7-24 High Low Logic Index

Chart 7-25 High Low Logic Index - weekly

Chart 7-26 High Low Logic - Appel

Chart 7-27 Low High Logic Index

Chart 7-28 High Low Validation Index

Chart 8-1-Up Volume 21-day smooth

Chart 8-2 Up Volume 10-day smooth

Chart 8-3 Up Volume 21-day Detrended

Chart 8-4 Down Volume 21-day smooth

Chart 8-5 Down Volume 21-day Detrended

Chart 8-6 Changed Volume - 21-day smooth

Chart 8-7 Up Volume and Down Volume

Chart 8-8 McClellan Oscillator - Volume

Chart 8-9 McClellan Summation - Volume

Next page
Light

Font size:

Reset

Interval:

Bookmark:

Make

Similar books «The Complete Guide to Market Breadth Indicators: How to Analyze and Evaluate Market Direction and Strength»

Look at similar books to The Complete Guide to Market Breadth Indicators: How to Analyze and Evaluate Market Direction and Strength. We have selected literature similar in name and meaning in the hope of providing readers with more options to find new, interesting, not yet read works.


Reviews about «The Complete Guide to Market Breadth Indicators: How to Analyze and Evaluate Market Direction and Strength»

Discussion, reviews of the book The Complete Guide to Market Breadth Indicators: How to Analyze and Evaluate Market Direction and Strength and just readers' own opinions. Leave your comments, write what you think about the work, its meaning or the main characters. Specify what exactly you liked and what you didn't like, and why you think so.