Joiner Bob - The Beginners Guide To The Ichimoku Stock Trading System
Here you can read online Joiner Bob - The Beginners Guide To The Ichimoku Stock Trading System full text of the book (entire story) in english for free. Download pdf and epub, get meaning, cover and reviews about this ebook. year: 2012, genre: Business. Description of the work, (preface) as well as reviews are available. Best literature library LitArk.com created for fans of good reading and offers a wide selection of genres:
Romance novel
Science fiction
Adventure
Detective
Science
History
Home and family
Prose
Art
Politics
Computer
Non-fiction
Religion
Business
Children
Humor
Choose a favorite category and find really read worthwhile books. Enjoy immersion in the world of imagination, feel the emotions of the characters or learn something new for yourself, make an fascinating discovery.

- Book:The Beginners Guide To The Ichimoku Stock Trading System
- Author:
- Genre:
- Year:2012
- Rating:5 / 5
- Favourites:Add to favourites
- Your mark:
The Beginners Guide To The Ichimoku Stock Trading System: summary, description and annotation
We offer to read an annotation, description, summary or preface (depends on what the author of the book "The Beginners Guide To The Ichimoku Stock Trading System" wrote himself). If you haven't found the necessary information about the book — write in the comments, we will try to find it.
Joiner Bob: author's other books
Who wrote The Beginners Guide To The Ichimoku Stock Trading System? Find out the surname, the name of the author of the book and a list of all author's works by series.


The Beginners Guide To The Ichimoku Stock Trading System — read online for free the complete book (whole text) full work
Below is the text of the book, divided by pages. System saving the place of the last page read, allows you to conveniently read the book "The Beginners Guide To The Ichimoku Stock Trading System" online for free, without having to search again every time where you left off. Put a bookmark, and you can go to the page where you finished reading at any time.
Font size:
Interval:
Bookmark:
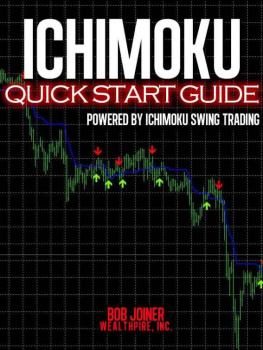
Ichimoku Quick Start Guide
By Robert C. Joiner
Could a Japanese journalist from the 1940s help you predict the future movement of stocks?
Welcome to this Quick Start Guide to using the Ichimoku charts. For most of you, the term Ichimoku is a brand new term for you. You may have never heard the word, much less seen a chart example. And Ill be honest with you. When I first looked at an Ichimoku chart, I thought No way. This is far too confusing to be of any use to me. But then I did a little study, finding bits and pieces of information, scattered here and there among various web sites. And the subject began to intrigue me. As I understood more and more about what the charts were telling me, I became hookedbecause the charts reveal so much and (once understood) can improve your trading substantially.
So, in this Quick Start Guide, Ill tell how the charts began. Ill introduce the key terms and definitions. Ill show you examples. And then Ill discuss some of the key uses for these charts in your own trading.
Now, before you get carried away and think youve got to pay a lot of money to get access to these charts, let me set the record straight. These charts are becoming available on more and more chart services. Offhand, I can think of three places to find these charts. At www.worden.com, the Ichimoku charts are available on their StockFinder charts and at www.freestockcharts.com. And they are available at www.stockcharts.com. Youll often find them as an optional overlay among the many technical indicators offered by these services.
A Short History of Ichimoku
One of our greatest imports was candlestick charting. Created for trading the rice market about 150 years ago, candlestick charts are widely used by traders today. Why? Because they give a better visual representation of price movement and investor sentiment than the old bar charts.
Well, in the 1940s a Japanese journalist by the name of Goichi Hosoda began creating moving averages for these candlesticks. Prior to the advent of computer programming, his elaborate system utilized dozens of workers who plotted his moving averages each day.
And it wasnt an ordinary system of moving averages. Goichi used a variety of moving averages, plotting them both in their current time frame and also plotting them into the future. These moving averages give support and resistance lines, much like traditional western moving averages. But Goichi also pointed these numbers into the future, giving the charts an almost predictive nature.
So let me ask you a question. If you could look into the future of a chart, looking at possible areas of support and resistance in future time (not just current time), do you think it could help your trading? Of course it could help you.
But Goichi also looked backward. He noticed that chart prices move in undulating waves (what I have called S-curves) and that future price movement can also be somewhat
predicted by plotting current price into its past price curve. (I call it the historical price curve.)
So, to summarize, Ichimoku charts look at past, current, and future indications of price movement. This combination, though not simple to understand, has huge merits above our traditional western technical analysis. In fact, Ichimoku charts could replace our typical charts, just as candlesticks have replaced bar charts for many traders. In Japan, for example, Ichimoku charts are the primary charts used for trading. And, once you begin to understand them, they may become your preferred chart platform as well.
Theres only one small problem. Very little has been written in English about Ichimoku charts. The primary reference tools are still in Japanese. So, unless you spend hundreds of hours studying these charts, then you may find them a bit intimidating.
There are dozens of books available about technical analysis. In fact, the interpretation of candlesticks alone has created a plethora of books to aid the traders understanding of them. But the study of Ichimoku charts in English is very new. And this Quick Start Guide aims to get you started on the journey.
First, I need to make a disclaimer. This report is not intended to be a complete primer on using Ichimoku charts. My Ichimoku Swing Trading System combines both eastern and western indicators. And this system takes more than just a few pages to cover all of the material. But this Quick Guide will get your started. Ill cover the key terms and definitions of Ichimoku charts. And Ill cover some of the basics for how to use them in your trading. If you want to learn more, then I encourage you to read and study the entire Ichimoku Swing Trading System text.
Terms and Definitions
So, weve talked about the history of Ichimoku and Ive described some of the possible value to you as a trader. Now lets go ahead a take a look at an example.
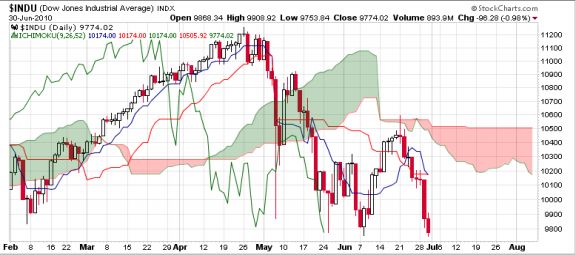
Chart 1
If Chart 1 is your first look at an Ichimoku chart, then it probably looks very confusing to you. You see a bunch of different lines and areas of green and pink. Then you see your traditional candlesticks. Youre looking at a five month chart of the Dow, during 2010. Beginning on the left side of the chart, see how price moves along the blue line and then falls beneath it in early May. Then you see price going back and forth in that green cloudy area before it falls again. Also see the green line that comes crashing through price back in late March. And notice how that cloudy area extends off to the right edge of the chart.
Now lets break down each area and see what it all means.
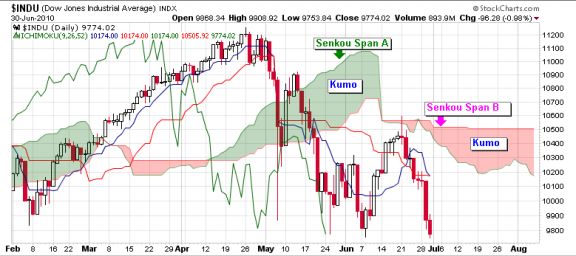
Chart 2
A central piece of the Ichimoku chart is the Kumo. Kumo means cloud, and thats what it looks like on your chartthose green and pink areas of the chart. So how are they created? To create the Kumo, you begin with two plotted linesSenkou Span A and Senkou Span B. Span A is created by taking the 9 and 26 moving averages (these moving averages use the mid-point of the candle, not the closing price of the candle) and dividing their total by 2. Span B is created by taking the high and low prices of the previous 52 periods and dividing that total by 2. Then, to make it more interesting, the answers to both equations are dropped onto the chart, 26 days into the future. Thats why the Kumo extends to the right edge of the chart, even though the market hasnt gotten to that point yet. Once we have Span A and B plotted into the future, we color the area in between the lines. If Span A is on top, then the Kumo is green. If Span B is on top, then the Kumo is pink.
That was fun, wasnt it? Now, think of the Kumo as an area of support and resistance. In the West, we generally draw single horizontal lines for support and resistance. But Ichimoku gives us an area. Take a look at mid-May in the above chart. You can see how the Kumo provided both support and resistance during that time, with prices often stopping right on the Span lines.
So heres the general rule. If price is above the Kumo, then the stock or index is said to be bullish. If price is below the Kumo, then the stock or index is said to be bearish. In Chart 2, we have examples of both bullish and bearish periods in the market. And you can see how price, once it moves through the Kumo, tends to stay on that side of the Kumo for a while.
Next pageFont size:
Interval:
Bookmark:
Similar books «The Beginners Guide To The Ichimoku Stock Trading System»
Look at similar books to The Beginners Guide To The Ichimoku Stock Trading System. We have selected literature similar in name and meaning in the hope of providing readers with more options to find new, interesting, not yet read works.
Discussion, reviews of the book The Beginners Guide To The Ichimoku Stock Trading System and just readers' own opinions. Leave your comments, write what you think about the work, its meaning or the main characters. Specify what exactly you liked and what you didn't like, and why you think so.