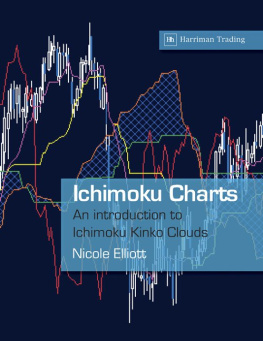
The book covers the history of candlestick charts - explaining the context in which they developed. It then moves on to explain how in the 1940s and 1950s a journalist, with the pseudonym Ichimoku Sanjin, started refining candlestick analysis by adding a series of moving averages. The book explains in detail how to construct Cloud charts and how to interpret them. A chapter is devoted to the advanced analysis of Cloud charts, with an in-depth study of the Three Principles: Wave Principle, Price Target and Timespan Principle. The book is illustrated throughout with numerous examples of Cloud chart analysis.
Introduction
A long time ago, and more years than I would care to admit to, I started my first City job as a junior dealer at the then small Bank of Scotland. Working in the money market section, with what at that time were cutting edge interest rate futures, my two bosses (there were only three of us) said:
You will be our expert on charts. All the futures dealers in Chicago use these, so off you go and learn.
And so I did. Later, armed with a pencil, graph paper, a couple of brief lessons under my belt and bare-faced cheek, I wormed my way in to the offices of the few jobbers and brokers who knew about Technical Analysis.
I immediately knew I had found my niche, and still today I often think my job is such fun. Everyday I have a jigsaw puzzle where I have all of the pieces, but there is no image to fit them to. You have to work the big picture out by yourself. It is also a little like dancing. Sometimes it is pure hard slog: tiring, tedious, repetitive, constant discipline, and my partner has two left feet. Then the other times (which more than make up for everything else) its truly fantastic, intuitive, creative, and I have Fred Astaire to lead me round the dance floor.
Over the years the pencil and paper were replaced with computer programs. Then one day I noticed a new technical study had been added to the vast array I already had to choose from. Called Ichimoku Kinko Hyo, I had never heard of it, despite having practised as a full-time Technical Analyst for almost twenty years. My initial reaction was one of shock-horror, when I looked at a chart and saw something that looked like a writhing mass of knotted, multi-coloured noodles.
I left the noodles alone for a while; but then ten years ago I went to work for a Japanese bank, and recognised the charts many of my Japanese colleagues were using: Spaghetti Junction! Curiosity got the better of me and - at the risk of losing my street cred as sole full-time chartist in a very macho dealing room - I asked them what these were.
Oh, cloud charts, they said. We all use them.
They did, and still do. And now I do too.
When the markets were quiet, I asked our very busy dollar/yen dealer, Harada-san, if he could explain them to me. Slowly (as he was very busy), and despite some language problems, I began to understand. Setting them up on my files, I started to use them every day. Questions arose as I went along, which then allowed me to progress to the next level with his explanations.
I now realise how much I owe Harada-san, because all the books on the subject are in Japanese and, quite frankly, I am too old to start learning a language in order to learn a new charting method.
This book distils what Ive learnt about Ichimoku Kinko Hyo over the last few years of working in a Japanese dealing room. I like the method and now use it every day - because it works. I hope you too find the clouds fascinating and profitable.
1. History
In this short chapter I thought it would be interesting to briefly describe the political and economic background that prevailed at the time that candlesticks were first thought of, and how Ichimoku Cloud charts evolved from these. The chapter ends with a calligraphic diversion that analyses the Chinese characters for Ichimoku Kinko Hyo.

