This book made available by the Internet Archive.
P reface
An understanding of statistics is vital in several different fields (see Unit 1 for some examples). This book can help you in two ways: by giving you a narrative introduction to the essential topics in statistics (Part I), and by giving you an alphabetical reference section (Part II) where you can look up topics as you need them. In Part I, we act as if the subject of statistics is new to you. Even if you have seen statistics before, we assume that you decided to read this book because it has been a while since you studied it and would like a review.
Several Greek letters and other special symbols are used in statistics. You should become familiar with the symbols that are listed on page v so you will recognize them when they appear in statistical formulas.
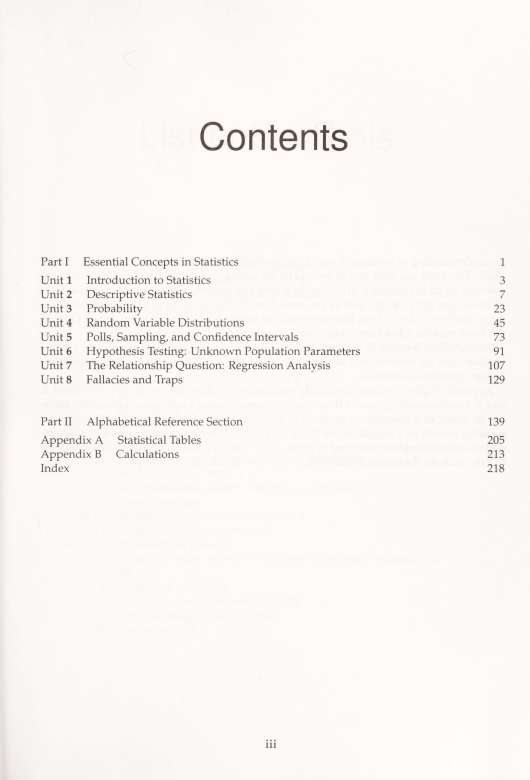
Appendix A gives the most commonly used statistical tables (for the normal, chi-square, t, and F distributions). Appendix B covers the process of using a calculator, a computer statistics program, or a spreadsheet program to perform statistical calculations. In the old days statistics developed a reputation for being very difficult, which certainly was true when laborious calculations had to be done by hand. Now, however, you can use computational tools to free you from the drudgery, allowing you to concentrate on the concepts.
List of Symbols
s

PrU)
Vr{A\B)
i

/()
/(*)
E(X)
Var(X)
Cov(X,F)

(capital sigma): summation notation (mu): population mean (sigma): population standard deviation population variance sample mean
sample standard deviation sample variance
probability that the event A occurs conditional probability that event A occurs given that event B occurs factorial (for example, 4! = 4x3x2xl) number of combinations of j objects chosen from a group of n objects
for a discrete random variable X f the probability function: /(a) = Pr(X = a)
for a continuous random variable X, the probability density function
expected value of random variable X variance of random variable X covariance of X and Y
r-squared value: measuring how well a regression equation fits the data
correlation coefficient (pi); approximately equal to 3.14159 approximately equal to 2.71828 square root of n
v


PART
Essential Concepts in
Statistics


UNIT 1
Introductio
o Statistics
Statistics is a valuable tool to help you analyze data. This book assumes you have studied statistics sometime in the past and would like a review, or perhaps you are new to the subject and would like a book that both gives a concise introduction and some reference material.
There are two main parts of the book. The first eight units consist of a narrative introduction to key ideas in statistics. These units avoid bogging you down in all of the details, but they have enough information for you to see the highlights of the crucial concepts. The second part is an alphabetical reference section that you can turn to for more information about specific topics as needed.
Suppose you are working as a researcher studying human behavior. You will need observations of many people for the variables you are interested in: perhaps age, height, food products consumed, time spent in various activities, and so on. One problem you would face after collecting the data is that it is hard for a person to see the meaning in a long list of numbers. It helps if we can illustrate the numbers with a graph, and it helps to summarize the numbers (for example, calculate the average). The subject of descriptive statistics (covered in Unit 2) considers ways of summarizing data.
Units 3 to 8 cover inferential statistics (or statistical inference ), where the problem is even harder: you usually are unable to obtain data about all of the items you are interested in. The complete set of items you are interested in is called the population. Typically it is too hard or expensive to investigate the entire population. Instead, you will have to content yourself with investigating a few items chosen from the population in a sample. In order for this to work, we must have some assurance that the sample will be representative of the population. This can be difficult, because any system we can think of for choosing the sample runs the risk of biasing it and making it unrepresentative. There are clearly some sample selection procedures that are not good. For example, we should not simply select people from our own home town, since they might be unrepresentative of people in the rest of the country. We would not know how unrepresentative in the absence of data about people in the rest of the country.
INTRODUCTION TO STATISTICS
It turns out that the best sample selection system is to have no systematic approach at all instead, select the sample totally at random. The ideal way would be to put the name of everyone in the population in a little capsule, put all of the capsules in a giant drum, mix them thoroughly, and then start selecting them at random. It is seldom possible in practice to follow this exact procedure, but the same concept applies to samples selected with computergenerated random number lists.
Your first reaction might well be that there is no guarantee that a randomly selected sample will be representative of the population. For example, it is possible that all of the people in your sample will be from your home town. However, you should realize that is unlikely. If the sample contains 1,000 people (a typical figure), chosen randomly from a population of over 200 million people, the chance that all 1,000 people will be from your home town is very, very small. In fact, the chance of the sample being unrepresentative in any manner is small, so we can have faith that it will give us an accurate picture of the population.

