it-ebooks - Computational and Inferential Thinking (UCB Data8)
Here you can read online it-ebooks - Computational and Inferential Thinking (UCB Data8) full text of the book (entire story) in english for free. Download pdf and epub, get meaning, cover and reviews about this ebook. year: 2017, publisher: iBooker it-ebooks, genre: Children. Description of the work, (preface) as well as reviews are available. Best literature library LitArk.com created for fans of good reading and offers a wide selection of genres:
Romance novel
Science fiction
Adventure
Detective
Science
History
Home and family
Prose
Art
Politics
Computer
Non-fiction
Religion
Business
Children
Humor
Choose a favorite category and find really read worthwhile books. Enjoy immersion in the world of imagination, feel the emotions of the characters or learn something new for yourself, make an fascinating discovery.
Computational and Inferential Thinking (UCB Data8): summary, description and annotation
We offer to read an annotation, description, summary or preface (depends on what the author of the book "Computational and Inferential Thinking (UCB Data8)" wrote himself). If you haven't found the necessary information about the book — write in the comments, we will try to find it.
it-ebooks: author's other books
Who wrote Computational and Inferential Thinking (UCB Data8)? Find out the surname, the name of the author of the book and a list of all author's works by series.


Computational and Inferential Thinking (UCB Data8) — read online for free the complete book (whole text) full work
Below is the text of the book, divided by pages. System saving the place of the last page read, allows you to conveniently read the book "Computational and Inferential Thinking (UCB Data8)" online for free, without having to search again every time where you left off. Put a bookmark, and you can go to the page where you finished reading at any time.
Font size:
Interval:
Bookmark:
- 1.1
- 1.2
- 1.2.1
- 1.2.1.1
- 1.2.1.2
- 1.2.2
- 1.2.3
- 1.2.3.1
- 1.2.3.2
- 1.2.1
- 1.3
- 1.3.1
- 1.3.2
- 1.3.3
- 1.3.4
- 1.3.5
- 1.4
- 1.4.1
- 1.4.2
- 1.4.3
- 1.4.3.1
- 1.4.4
- 1.5
- 1.5.1
- 1.5.1.1
- 1.5.2
- 1.5.3
- 1.5.4
- 1.5.5
- 1.5.6
- 1.5.1
- 1.6
- 1.6.1
- 1.6.2
- 1.6.3
- 1.6.4
- 1.7
- 1.7.1
- 1.7.2
- 1.7.3
- 1.8
- 1.8.1
- 1.8.2
- 1.8.3
- 1.8.4
- 1.8.5
- 1.9
- 1.9.1
- 1.9.2
- 1.9.3
- 1.9.4
- 1.9.5
- 1.10
- 1.10.1
- 1.10.2
- 1.10.3
- 1.11
- 1.11.1
- 1.11.2
- 1.11.3
- 1.11.4
- 1.12
- 1.12.1
- 1.12.2
- 1.12.3
- 1.12.4
- 1.13
- 1.13.1
- 1.13.2
- 1.13.3
- 1.13.4
- 1.13.5
- 1.13.6
- 1.14
- 1.14.1
- 1.14.2
- 1.14.3
- 1.14.4
- 1.14.5
- 1.14.6
- 1.15
- 1.15.1
- 1.15.2
- 1.15.3
- 1.16
- 1.16.1
- 1.16.2
- 1.16.3
- 1.16.4
- 1.16.5
- 1.16.6
- 1.17
- 1.17.1
- 1.17.2
- 1.17.3
- 1.18
- 1.18.1
- 1.18.2
We have used random permutations to see whether two samples are drawn from the same underlying categorical distribution. If the samples are numerical, the same method can be used; the choice of test statistic is usually simpler. In our example with the Deflategate data, we used the difference of means to test whether the Patriots' and Colts' balls came from the same underlying distribution.
In modern data analytics, deciding whether two numerical samples come from the same underlying distribution is called A/B testing. The name refers to the labels of the two samples, A and B.
We have performed many different analyses on our random sample of mothers and their newborn infants, but we haven't yet looked at the data whether the mothers smoked. One of the aims of the study was to see whether maternal smoking was associated with birth weight.
| Birth Weight | Gestational Days | Maternal Age | Maternal Height | Maternal Pregnancy Weight | Maternal Smoker |
|---|---|---|---|---|---|
| 120 | 284 | 27 | 62 | 100 | False |
| 113 | 282 | 33 | 64 | 135 | False |
| 128 | 279 | 28 | 64 | 115 | True |
| 108 | 282 | 23 | 67 | 125 | True |
| 136 | 286 | 25 | 62 | 93 | False |
| 138 | 244 | 33 | 62 | 178 | False |
| 132 | 245 | 23 | 65 | 140 | False |
| 120 | 289 | 25 | 62 | 125 | False |
| 143 | 299 | 30 | 66 | 136 | True |
| 140 | 351 | 27 | 68 | 120 | False |
... (1164 rows omitted)
We'll start by selecting just Birth Weight and Maternal Smoker. There are 715 non-smokers among the women in the sample, and 459 smokers.
| Maternal Smoker | count |
|---|---|
| False | 715 |
| True | 459 |
The first histogram below displays the distribution of birth weights of the babies of the non-smokers in the sample. The second displays the birth weights of the babies of the smokers.
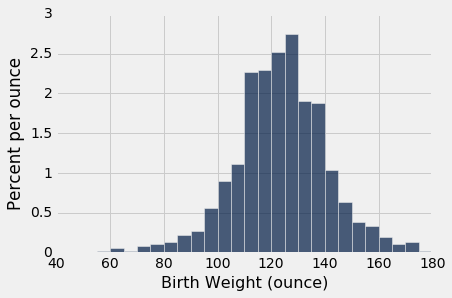
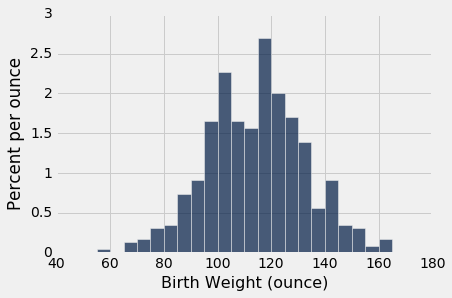
Both distributions are approximately bell shaped and centered near 120 ounces. The distributions are not identical, of course, which raises the question of whether the difference reflects just chance variation or a difference in the distributions in the population.
This question can be answered by a test of hypotheses.
Null hypothesis: In the population, the distribution of birth weights of babies is the same for mothers who don't smoke as for mothers who do. The difference in the sample is due to chance.
Alternative hypothesis: The two distributions are different in the population.
Test statistic: Birth weight is a quantitative variable, so it is reasonable to use the absolute difference between the means as the test statistic.
The observed value of the test statistic is about 9.27 ounces.
| Maternal Smoker | Birth Weight mean |
|---|---|
| False | 123.085 |
| True | 113.819 |
To see whether such a difference could have arisen due to chance under the null hypothesis, we will use a permutation test just as we did in the previous section. All we have to change is the code for the test statistic. For that, we'll compute the difference in means as we did above, and then take the absolute value.
Remember that under the null hypothesis, all permutations of birth weight are equally likely to be appear with the Maternal Smoker column. So, just as before, each repetition starts with shuffling the variable being compared.
Font size:
Interval:
Bookmark:
Similar books «Computational and Inferential Thinking (UCB Data8)»
Look at similar books to Computational and Inferential Thinking (UCB Data8). We have selected literature similar in name and meaning in the hope of providing readers with more options to find new, interesting, not yet read works.
Discussion, reviews of the book Computational and Inferential Thinking (UCB Data8) and just readers' own opinions. Leave your comments, write what you think about the work, its meaning or the main characters. Specify what exactly you liked and what you didn't like, and why you think so.