• Complain

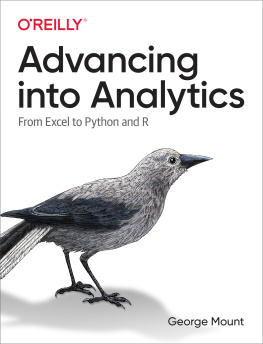
George Mount - Advancing into Analytics: From Excel to Python and R

Here you can read online George Mount - Advancing into Analytics: From Excel to Python and R full text of the book (entire story) in english for free. Download pdf and epub, get meaning, cover and reviews about this ebook. year: 2021, publisher: Oreilly & Associates Inc, genre: Children. Description of the work, (preface) as well as reviews are available. Best literature library LitArk.com created for fans of good reading and offers a wide selection of genres:

Romance novel Science fiction Adventure Detective Science History Home and family Prose Art Politics Computer Non-fiction Religion Business Children Humor

Choose a favorite category and find really read worthwhile books. Enjoy immersion in the world of imagination, feel the emotions of the characters or learn something new for yourself, make an fascinating discovery.

George Mount Advancing into Analytics: From Excel to Python and R
  • Book:
    Advancing into Analytics: From Excel to Python and R
  • Author:
  • Publisher:
    Oreilly & Associates Inc
  • Genre:
  • Year:
    2021
  • Rating:
    4 / 5
  • Favourites:
    Add to favourites
  • Your mark:
    • 80
    • 1
    • 2
    • 3
    • 4
    • 5

Advancing into Analytics: From Excel to Python and R: summary, description and annotation

We offer to read an annotation, description, summary or preface (depends on what the author of the book "Advancing into Analytics: From Excel to Python and R" wrote himself). If you haven't found the necessary information about the book — write in the comments, we will try to find it.

Data analytics may seem daunting, but if youre familiar with Excel, you have a head start that can help you make the leap into analytics. Advancing into Analytics will lower your learning curve.

Author George Mount, founder and CEO of Stringfest Analytics, clearly and gently guides intermediate Excel users to a solid understanding of analytics and the data stack. This book demonstrates key statistical concepts from spreadsheets and pivots your existing knowledge about data manipulation into R and Python programming.

With this practical book at your side, youll learn how to:

  • Explore a dataset for potential research questions to check assumptions and to build hypotheses
  • Make compelling business recommendations using inferential statistics
  • Load, view, and write datasets using R and Python
  • Perform common data wrangling tasks such as sorting, filtering, and aggregating using R and Python
  • Navigate and execute code in Jupyter notebooks
  • Identify, install, and implement the most useful open source packages for your needs
  • And more

George Mount: author's other books


Who wrote Advancing into Analytics: From Excel to Python and R? Find out the surname, the name of the author of the book and a list of all author's works by series.

Advancing into Analytics: From Excel to Python and R — read online for free the complete book (whole text) full work

Below is the text of the book, divided by pages. System saving the place of the last page read, allows you to conveniently read the book "Advancing into Analytics: From Excel to Python and R" online for free, without having to search again every time where you left off. Put a bookmark, and you can go to the page where you finished reading at any time.

Light

Font size:

Reset

Interval:

Bookmark:

Make
Advancing into Analytics by George Mount Copyright 2021 Candid World - photo 1
Advancing into Analytics

by George Mount

Copyright 2021 Candid World Consulting, LLC. All rights reserved.

Printed in the United States of America.

Published by OReilly Media, Inc. , 1005 Gravenstein Highway North, Sebastopol, CA 95472.

OReilly books may be purchased for educational, business, or sales promotional use. Online editions are also available for most titles (http://oreilly.com). For more information, contact our corporate/institutional sales department: 800-998-9938 or corporate@oreilly.com .

  • Acquisitions Editor: Michelle Smith
  • Development Editor: Corbin Collins
  • Production Editor: Daniel Elfanbaum
  • Copyeditor: JM Olejarz
  • Proofreader: Justin Billing
  • Indexer: Sam Arnold-Boyd
  • Interior Designer: David Futato
  • Cover Designer: Karen Montgomery
  • Illustrator: Kate Dullea
  • April 2021: First Edition
Revision History for the First Edition
  • 2021-04-15: First Release

See http://oreilly.com/catalog/errata.csp?isbn=9781492094340 for release details.

The OReilly logo is a registered trademark of OReilly Media, Inc. Advancing into Analytics, the cover image, and related trade dress are trademarks of OReilly Media, Inc.

The views expressed in this work are those of the author, and do not represent the publishers views. While the publisher and the author have used good faith efforts to ensure that the information and instructions contained in this work are accurate, the publisher and the author disclaim all responsibility for errors or omissions, including without limitation responsibility for damages resulting from the use of or reliance on this work. Use of the information and instructions contained in this work is at your own risk. If any code samples or other technology this work contains or describes is subject to open source licenses or the intellectual property rights of others, it is your responsibility to ensure that your use thereof complies with such licenses and/or rights.

978-1-492-09434-0

[LSI]

Preface

Youre about to partake in a significant and commendable learning journey that will involve statistics, coding, and more. Before diving in, Id like to take some time to address my learning objectives for you, how I arrived at this book, and what you should expect.

Learning Objective

By the end of this book, you should be able to conduct exploratory data analysis and hypothesis testing using a programming language.Exploring and testing relationships is core to analytics. With the tools and frameworks youll pick up in this book, you will be well positioned to continue learning more advanced data analysis techniques.

Well be using Excel, R, and Python because these are powerful tools, and because they make for a seamless learning journey. Few books cover this combination, even though the progression from spreadsheets into programming is common for analysts, myself included.

Prerequisites

To meet these objectives, this book makes some technical and technological assumptions .

Technical Requirements

I am writing this book on a Windows computer with the Office 365version of Excel for desktop. As long as you have a paid version of Excel 2010 or greater for either Windows or Mac installed on your machine, you should be able to follow along with the majority of the instruction in this book, with some variations, particularly with PivotTables and data visualization.

Note

While Excel offers both free and paid versions online, a paid desktop version is needed to access some of the features covered in this book.

R and Python are both free, open source tools available for all majoroperating systems. I address how to install them later in thebook.

Technological Requirements

This book assumes no prior knowledge of R or Python; that said, it does rely on moderate knowledge of Excel to flatten that learning curve.

The Excel topics you should be familiar with include the following:

  • Absolute, relative, and mixed cell references

  • Conditional logic and conditional aggregation (IF() statements,SUMIF()/SUMIFS(), and so forth)

  • Combining data sources (VLOOKUP(), INDEX()/MATCH(), and so forth)

  • Sorting, filtering, and aggregating data with PivotTables

  • Basic plotting (bar charts, line charts, and so forth)

If you would like more practice with these topics before moving on, Isuggest Excel2019 Bible by Michael Alexander et al. (Wiley).

How I Got Here

Like many in our field, my route to analytics was circuitous. In school, mathematics became a subject I actively avoided; too much of it seemed entirely theoretical. I did have some coursework in statistics and econometrics that caught my interest. It was a breath of fresh air to apply mathematics to some concrete end.

This exposure to statistics was admittedly scant. I attended a liberal arts college, where I picked up solid writing and thinking skills, but few quantitative ones. When I got to my first full-time job, I was floored by the depth and breadth of the data I was entrusted with managing. Much of this data lived in spreadsheets and was hard to get much value out of without intense cleaning and preparation.

Some of this data wrangling is to be expected; the New York Times has reported that data scientists spend 50% to 80% of their time preparing data for analysis. But I wondered if there were more efficient ways to clean, manage, and store data. In particular, I wanted to do this so I could spend more time analyzing the data. After all, I always found statistical analysis somewhat palatablemanual and error-prone spreadsheet data preparation, not so much.

Because I enjoyed writing (thank you, liberal arts degree), I started blogging about tips I picked up in Excel. Through good grace and hard work, the blog gained traction, and I attribute much of my professional success to it. You are welcome to stop by at stringfestanalytics.com; I still post regularly on Excel and analytics more generally .

As I began to learn more about Excel, my interest spread to other analytics tools and techniques. By this point, the open source programming languages R and Python had gained significant popularity in the data world. But while I made my way through grasping these languages, I felt unnecessary friction in the learning path.

Excel Bad, Coding Good

I noticed thatfor Excel users, most R or Pythontraining sounded a lot like this:

All along, youve been using Excel when you really should have been programming. Look at all these problems Excel has caused! Time to kick the habit entirely.

Thats the wrong attitude to take for a couple of reasons:

Its not accurate

The choice between coding and spreadsheets is often framed like a sort of struggle between good and evil. In reality, its better to think of these as complementary tools rather than substitutes. Spreadsheets have their place in analytics; so does programming. Learning and using one does not negate the other. discusses this relationship.

Its a poor instructional approach

Excel users intuitively understand how to work with data: they can sort, filter, group, and join it. They know which arrangements make for easy analysis, and which mean lots of cleanup. This is a wealth of knowledge to build on. Good instruction will use it to bridge the gap between spreadsheets and coding. Unfortunately, most instruction instead burns the bridge out of contempt.

Next page
Light

Font size:

Reset

Interval:

Bookmark:

Make

Similar books «Advancing into Analytics: From Excel to Python and R»

Look at similar books to Advancing into Analytics: From Excel to Python and R. We have selected literature similar in name and meaning in the hope of providing readers with more options to find new, interesting, not yet read works.


Reviews about «Advancing into Analytics: From Excel to Python and R»

Discussion, reviews of the book Advancing into Analytics: From Excel to Python and R and just readers' own opinions. Leave your comments, write what you think about the work, its meaning or the main characters. Specify what exactly you liked and what you didn't like, and why you think so.