In this chapter, you will learn the essential Python commands and functions you will need to produce the illustrations shown in this book. You will learn how to use Pythons basic plotting functions, set up a plotting area, create a set of two-dimensional coordinate axes, and use basic plotting primitives (the dot, the line, and the arrow), which are the building blocks you will use to construct images throughout this book. In Chapter .
1.1 Programming Style
First a note on the programming style used in this book. We all have preferences when it comes to style. I favor a clear, top-down, open style. Many programmers try to reduce their code to as few lines as possible. That may be fine in practice but in an instructional text, such as we have here, I believe it is better to proceed slowly in small, simple steps. The intention is to keep everything clear and understandable. Since I do not know the skill level of the readers, and since I want to make this book accessible to as wide an audience as possible, I generally start each topic from an elementary level, although I do assume some familiarity with the Python language. If you are just learning Python, you will benefit from the material in this first chapter. If you are an accomplished Pythoner, you could probably skip it and move on to Chapter .
Some Python developers advocate using long descriptive names for variables such as temperature rather than T. I find excessively long variable names make the code difficult to read. Its a matter of preference. With relatively short programs such as we have in this book, theres no need for complex programming. Try to adopt a style that is robust rather than elegant but fragile.
My programs usually have the same structure. The first few statements are generally import numpy as np , import matplotlib.pyplot as plt , and so on. Sometime I will import from the math library with from math import sin, cos, radians, sqrt . These are commonly used functions in graphics programming. Importing them separately in this way eliminates the need to use prefixes as in np .sin(); you can just use sin() . Then I most often define the plotting area with plt.axis([0,150,100,0]) . As explained in Section 1.2, these values, where the x axis is 50% wider than the y axis, produce a round circle and a square square without reducing the size of the plotting area. At this point, axes can be labelled and the plot titled if desired. Next, I usually define parameters (such as diameters, time constants, and so on) and lists. Then I define functions. Finally, in lengthy programs, at the bottom I put a control section that invokes the functions in the proper order.
Including plt.axis('on') plots the axes; plt.grid(True) plots a grid. They are very convenient options when developing graphics. However, if I do not want the axes or grid to show in the final output, I replace these commands with plt.axis('off') and plt.grid(False) . The syntax must be as shown here. See Section 1.10 to learn how to create your own grid lines if you are not satisfied with Pythons defaults.
I often begin development of graphics by using the scatter() function which produces what I call scatter dots . They are fast and easy to use and are very useful in the development stage. If kept small enough and spaced closely together, dots can produce acceptable lines and curves. However, they can sometimes appear a bit fuzzy so, after I have everything working right, I will often go back and replace the dots with short line segments using either arrows via plt.arrow() or lines via plt.plot() . There is another aspect to the choice of dots or lines: which overplots which. You dont want to create something with dots and then find lines covering it up. This is discussed in Section 1.14.
Some variants of Python require the plt.show() statement at the end to plot graphics. My setup, Anaconda with Spyder and Python 3.5 (see Appendix A for installation instructions), does not require this but I include it anyway since it serves as a marker for the end of the program. Finally, press the F5 key or click on the Run button at the top to see what you have created. After you are satisfied, you can save the plot by right-clicking it and specifying a location.
Regarding the use of lists, tuples and arrays, they can be a great help, particularly when doing graphics programming that involves a lot of data points. They are explained in Section 1.19.5. An understanding of them, together with a few basic graphics commands and techniques covered in this chapter, are all you need to create the illustrations and images you see in this book.
1.2 The Plotting Area
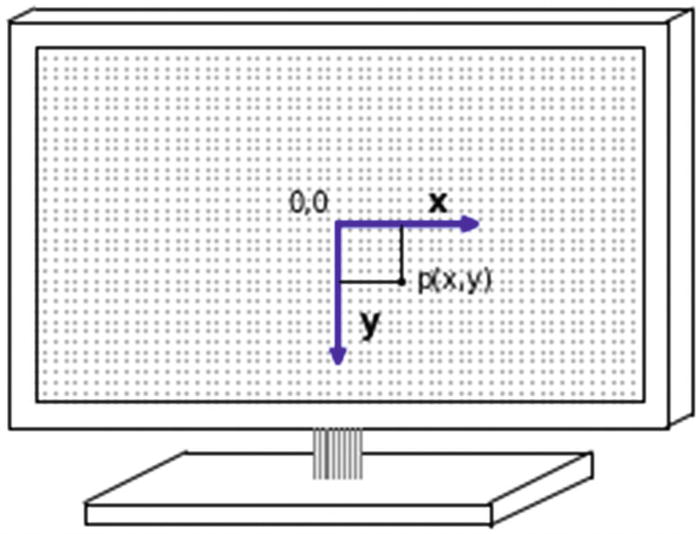
A computer display with a two-dimensional coordinate system is shown in Figure . In this example, the origin of the x,y coordinate axes, (x=0, y=0), is located in the center of the screen. The positive x axis runs from the origin to the right; the y axis runs from the origin vertically downward. As you will see shortly, the location of the origin can be changed as can the directions of the x and y axes. Also shown is a point p at coordinates (x,y), which are in relation to the x and y axes.
The direction of the y axis pointing down in Figure may seem a bit unusual. When plotting data or functions such as y=cos(x) or y=exp(x), we usually think of y as pointing up. But when doing technical graphics , especially in three dimensions, as you will see later, it is more intuitive to have the y axis point down. This is also consistent with older variants of BASIC where the x axis ran along the top of the screen from left to right and the y axis ran down the left side. As you will see, you can define y to point up or down, whichever best suits what you are plotting.
1.3 Establishing the Size of the Plotting Area
The plotting area contains the graphic image. It always appears the same physical size when displayed in the Spyder output pane. Spyder is the programming environment (see Appendix A). However, the numerical size of the plotting area, and of the values of the point, line, and arrow definitions within the plotting area, can be specified to be anything. Before doing any plotting, you must first establish the areas numerical size. You must also specify the location of the coordinate systems origin and the directions of the coordinate axes. As an illustration, Listing uses the plt.axis([x1,x2,y1,y2]) function in line 8 to set up an area running from x=-10 to +10; y=10 to +10. The rest of the script will be explained shortly.
Figure 1-2
A two-dimensional x,y coordinate system with its origin (0,0) centered in the screen. A point p is shown at coordinates (x,y) relative to x,y.
1 import numpy as np
2 import matplotlib.pyplot as plt
4 x1=-10
5 x2=10
6 y1=-10
7 y2=10
8 plt.axis([x1,x2,y1,y2] )
10 plt.axis('on')
11 plt.grid(True)
13 plt.show()
Listing 1-1
Program PLOTTING_AREA
Listing will be explained in the following sections. These commands, or variations of them, will appear in all of our programs.

