Chapter 1
About This Book
Discovering JMP provides a general introduction to the JMP software. This guide assumes that you have no knowledge of JMP. Whether you are an analyst, researcher, student, professor, or statistician, this guide gives you a general overview of JMPs user interface and features.
This guide introduces you to the following information:
Starting JMP
The structure of a JMP window
Preparing and manipulating data
Using interactive graphs to learn from your data
Performing simple analyses to augment graphs
Customizing JMP and special features
Sharing your results
This guide contains six chapters. Each chapter contains examples that reinforce the concepts presented in the chapter. All of the statistical concepts are at an introductory level. The sample data used in this book are included with the software. Here is a description of each chapter:
provides an overview of the JMP application. You learn how content is organized and how to navigate the software.
describes how to import data from a variety of sources, and prepare it for analysis. There is also an overview of data manipulation tools.
describes graphs and charts that you can use to visualize and understand your data. The examples range from simple analyses involving a single variable, to multiple-variable graphs that enable you to see relationships between many variables.
describes many commonly used analysis techniques. These techniques range from simple techniques that do not require the use of statistical methods, to advanced techniques, where knowledge of statistics is useful.
shows you how to analyze distributions, patterns, and similar values in several platforms.
describes sharing your work with non JMP users in PowerPoint presentations, interactive HTML, and Adobe Flash. Saving analyses as scripts and saving work in journals and projects for JMP users are also covered.
describes how to automatically update graphs and analyses as data changes, how to use preferences to customize your reports, and how JMP interacts with SAS.
After reviewing this guide, you will be comfortable navigating and working with your data in JMP.
JMP is available for both Windows and Macintosh operating systems. However, the material in this guide is based on a Windows operating system.
Save Platform Results in Journals
Save platform reports for future viewing by creating a journal of the report window. The journal is a copy of the report window. You can edit or append additional reports to an existing journal. The journal is not connected to the data table. A journal is an easy way to save the results from several report windows in a single report window that you can share with others.
Example of Creating a Journal
Select Help > Sample Data Library and open Companies.jmp.
Select Analyze > Distribution.
Select both Type and Size Co and click Y, Columns.
Click .
From the red triangle menu for Type, select Histogram Options > Show Counts.
From the red triangle menu for Size Co, select Mosaic Plot.
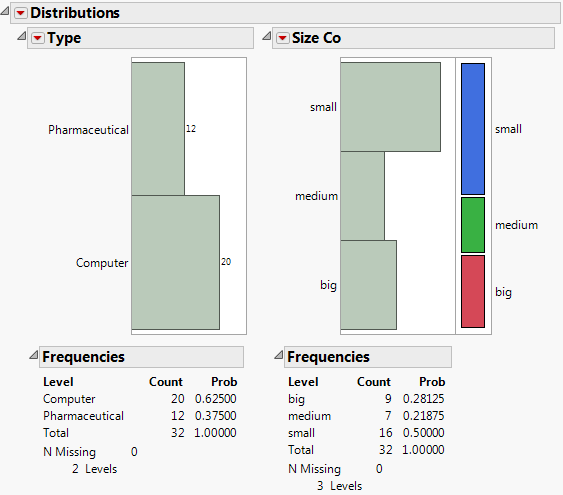
Select Edit > Journal to journal these results. The results are duplicated in a journal window.
Figure 7.2 Journal of Distribution Results
The results in the journal are not connected to the data table. In the Type bar chart, if you click the Computer bar, no rows are selected in the data table.
Since the journal is a copy of your results, most of the red triangle menus do not exist. A journal does have a red triangle menu for each new report that you add to the journal. This menu has two options:
Rerun in new window
If you have the original data table that was used to create the original report, this option runs the analysis again. The result is a new report window.
Edit Script
This option opens a script window that contains a JSL script to re-create the analysis. JSL is a more advanced topic that is covered in the Scripting Guide and JSL Syntax Reference.
Add Analyses to a Journal
If you perform another analysis, you can add the results of the analysis to the existing journal.
With a journal open, select Analyze > Distribution.
Select profit/emp and click Y, Columns.
Click .
Select Edit > Journal. The results are appended to the bottom of the journal.
Create a Project
A JMP project provides a way to organize files that you use in an analysis. You can add JMP files (reports, data tables, scripts, journals, and so on) and non JMP files, such as Microsoft PowerPoint or Adobe PDF files. After you perform an analysis, the graph and report appear in the project on tabs. You can display multiple reports or graphs, display the log, and run scripts from the project. Reports and graphs remain linked to the data table.
Projects help you avoid overlapping or concealed JMP windows. You can maximize the project window to have a bigger view of the project. And when you save the project, the state of the project is saved (for example, the open reports and the layout of the window).
Create a New Project and Add Data Tables
To start a new project, select File > > Project. A window appears that shows the untitled project.
Select File > Open and browse to the JMP Samples/Data folder.
Press Shift and click Car Physical Data.jmp and Car Poll.jmp.
Click Open.
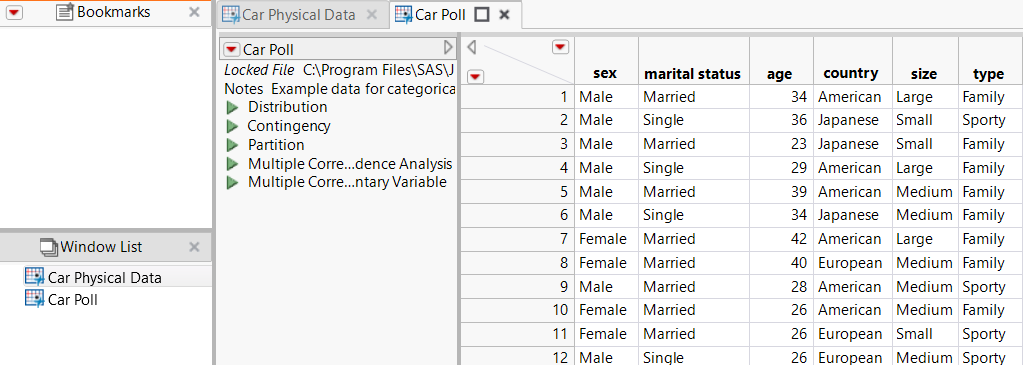
The data tables are added to the project.
Select File > Save Project and save the file as Cars.jmpprj.
Figure 7.3 Initial Project
Tip: When you open a file using File > Open, and a project is active, the file will be added to the project automatically.
Add and Organize Bookmarks
Bookmarks provide quick access to files that you regularly open.
In the Window List, right-click one of the file names and select Bookmark All.
You can also drag the files from the Window List to the Bookmarks pane.
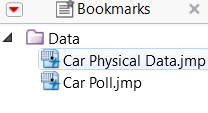
Create a group for the data tables by selecting New Group from the Bookmarks red triangle menu. The group organizes the files but does not move them on your computer.
Enter Data and click .
In the Bookmarks pane, select the Car data tables and drag them into the Data group.
Figure 7.4 Bookmarked Files
Rearrange Reports
You can rearrange reports to display them in a separate pane. As you drag the report tab, zones appear that show you where to place, or dock, the report.
In Car Physical Data.jmp, run the Contingency script.
In





![EMC Education Services [EMC Education Services] - Data Science and Big Data Analytics: Discovering, Analyzing, Visualizing and Presenting Data](/uploads/posts/book/119625/thumbs/emc-education-services-emc-education-services.jpg)


