Data science is an exciting discipline that allows you to turn raw datainto understanding, insight, and knowledge. The goal of R for DataScience is to help you learn the most important tools in R that willallow you to do data science. After reading this book, youll have thetools to tackle a wide variety of data science challenges, using thebest parts of R.
What You Will Learn
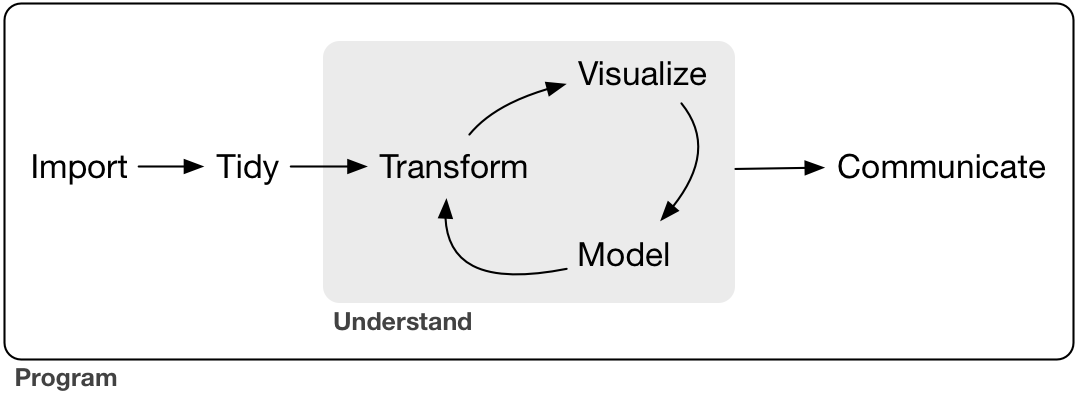
Data science is a huge field, and theres no way you can master it byreading a single book. The goal of this book is to give you a solidfoundation in the most important tools. Our model of the tools needed ina typical data science project looks something like this:
First you must import your data into R. This typically means that youtake data stored in a file, database, or web API, and load it into adata frame in R. If you cant get your data into R, you cant do datascience on it!
Once youve imported your data, it is a good idea to tidy it. Tidyingyour data means storing it in a consistent form that matches thesemantics of the dataset with the way it is stored. In brief, when yourdata is tidy, each column is a variable, and each row is an observation.Tidy data is important because the consistent structure lets you focusyour struggle on questions about the data, not fighting to get the datainto the right form for different functions.
Once you have tidy data, a common first step is to transform it.Transformation includes narrowing in on observations of interest (likeall people in one city, or all data from the last year), creating newvariables that are functions of existing variables (like computingvelocity from speed and time), and calculating a set of summarystatistics (like counts or means). Together, tidying and transformingare called wrangling, because getting your data in a form thatsnatural to work with often feels like a fight!
Once you have tidy data with the variables you need, there are two mainengines of knowledge generation: visualization and modeling. These havecomplementary strengths and weaknesses so any real analysis will iteratebetween them many times.
Visualization is a fundamentally human activity. A good visualizationwill show you things that you did not expect, or raise new questionsabout the data. A good visualization might also hint that youre askingthe wrong question, or you need to collect different data.Visualizations can surprise you, but dont scale particularly wellbecause they require a human to interpret them.
Models are complementary tools to visualization. Once you have madeyour questions sufficiently precise, you can use a model to answer them.Models are a fundamentally mathematical or computational tool, so theygenerally scale well. Even when they dont, its usually cheaper to buymore computers than it is to buy more brains! But every model makesassumptions, and by its very nature a model cannot question its ownassumptions. That means a model cannot fundamentally surprise you.
The last step of data science is communication, an absolutely criticalpart of any data analysis project. It doesnt matter how well yourmodels and visualization have led you to understand the data unless youcan also communicate your results to others.
Surrounding all these tools is programming. Programming is across-cutting tool that you use in every part of the project. You dontneed to be an expert programmer to be a data scientist, but learningmore about programming pays off because becoming a better programmerallows you to automate common tasks, and solve new problems with greaterease.
Youll use these tools in every data science project, but for mostprojects theyre not enough. Theres a rough 80-20 rule at play; you cantackle about 80% of every project using the tools that youll learn inthis book, but youll need other tools to tackle the remaining 20%.Throughout this book well point you to resources where you can learnmore.
How This Book Is Organized
The previous description of the tools of data science is organizedroughly according to the order in which you use them in an analysis(although of course youll iterate through them multiple times). In ourexperience, however, this is not the best way to learn them:
Starting with data ingest and tidying is suboptimal because 80% ofthe time its routine and boring, and the other 20% of the time itsweird and frustrating. Thats a bad place to start learning a newsubject! Instead, well start with visualization and transformation ofdata thats already been imported and tidied. That way, when you ingestand tidy your own data, your motivation will stay high because you knowthe pain is worth it.
Some topics are best explained with other tools. For example, webelieve that its easier to understand how models work if you alreadyknow about visualization, tidy data, and programming.
Programming tools are not necessarily interesting in their own right,but do allow you to tackle considerably more challenging problems. Wellgive you a selection of programming tools in the middle of the book, andthen youll see they can combine with the data science tools to tackleinteresting modeling problems.
Within each chapter, we try to stick to a similar pattern: start withsome motivating examples so you can see the bigger picture, and thendive into the details. Each section of the book is paired with exercisesto help you practice what youve learned. While its tempting to skipthe exercises, theres no better way to learn than practicing on realproblems.

