Roger Cornejo
Dynamic Oracle Performance Analytics Using Normalized Metrics to Improve Database Speed
Roger Cornejo
Durham, NC, USA
Any source code or other supplementary material referenced by the author in this book is available to readers on GitHub via the books product page, located at www.apress.com/9781484241363 . For more detailed information, please visit http://www.apress.com/source-code .
ISBN 978-1-4842-4136-3 e-ISBN 978-1-4842-4137-0
https://doi.org/10.1007/978-1-4842-4137-0
Library of Congress Control Number: 2018965195
Roger Cornejo 2018
This work is subject to copyright. All rights are reserved by the Publisher, whether the whole or part of the material is concerned, specifically the rights of translation, reprinting, reuse of illustrations, recitation, broadcasting, reproduction on microfilms or in any other physical way, and transmission or information storage and retrieval, electronic adaptation, computer software, or by similar or dissimilar methodology now known or hereafter developed.
Trademarked names, logos, and images may appear in this book. Rather than use a trademark symbol with every occurrence of a trademarked name, logo, or image we use the names, logos, and images only in an editorial fashion and to the benefit of the trademark owner, with no intention of infringement of the trademark. The use in this publication of trade names, trademarks, service marks, and similar terms, even if they are not identified as such, is not to be taken as an expression of opinion as to whether or not they are subject to proprietary rights.
While the advice and information in this book are believed to be true and accurate at the date of publication, neither the authors nor the editors nor the publisher can accept any legal responsibility for any errors or omissions that may be made. The publisher makes no warranty, express or implied, with respect to the material contained herein.
Distributed to the book trade worldwide by Springer Science+Business Media New York, 233 Spring Street, 6th Floor, New York, NY 10013. Phone 1-800-SPRINGER, fax (201) 348-4505, e-mail orders-ny@springer-sbm.com, or visit www.springeronline.com. Apress Media, LLC is a California LLC and the sole member (owner) is Springer Science + Business Media Finance Inc (SSBM Finance Inc). SSBM Finance Inc is a Delaware corporation.
To Jeanne
About 35 years ago, you painted this quote for me on a watercolor:
Come grow old with me, the best is yet to be. There are no regrets. It is a wonderful journey with you by my side.
Introduction
In the practice of performance tuning, change is inevitable. New techniques are created; old ones are updated. The volume of metrics, especially those contained in Oracles Automatic Workload Repository (AWR), is multiplying almost daily. Despite the autonomous database, monitoring tools, and other similar tools, the level of expertise required to analyze database performance problems has increased. To survive and thrive in this field, innovation is everything. Nothing remains the same for long. We either innovate and adapt to change or change happens to us.
The purpose of this book is not simply to help you adapt to change but to equip you with a method of analysis that will enable you to thrive and even lead in the application of creative big data science methods for Oracle performance analysis and tuning.
Before I begin to tell you about a process that I think you will find very potent, albeit very different from what you might be currently using, I want to tell you about my background in performance tuning. Id like you to know that Ive seen a lot of change and Ive been where many of you are.
I began using Oracle as a software developer in 1985 (version 4.1.4). One important aspect of my work was to ensure high performance of enterprise class applications, so tuning was a necessary part of the job. At that time, there was little to no Oracle internal instrumentation exposed to the average user, so tuning involved a lot of guesswork. I relied on a careful study of the application architecture and used custom instrumentation for coarse-grained metrics.
When Oracle began to introduce internal metrics to the users, they did this through a series of views called dynamic performance views but commonly referred to as v$ views since they are prefixed with v$. The v$ views include a host of metrics, many of which will be familiar to tuning experts, including v$session, v$sqlarea, v$sysstat, and v$OSstat.
Like many of my tuning peers, I quickly embraced these metrics as a primary source of metrics for finding problems in databases that needed tuning. The v$ views provide values for metrics for near real time. They are useful for solving problems that are happening at the present time, but since the metrics are not persisted over time, they are not very helpful when solving problems that happened in the past. This, of course, constrained the kinds of problems that I could solve quickly or the reproducibility of the problems that I was trying to solve.
With Oracles introduction of the bStat/eStat utilities, I could see what happened during an interval of time, but I still had to be present when the problem was occurring (see sidebar note on bStat and eStat utilities).
Oracle made an improvement to the v$ views and the bStat/eStat utilities mechanisms by providing StatsPack, which captured many of those metrics over time and then persisted historic values for the metrics. With this added capability, I could look at past performance even when the problem was no longer apparent [occurring on the database]. I took a similar approach to querying StatsPack data as I used with the v$ view counterparts.
Note on the bStat/eStat utilities: This is a much-antiquated approach provided by Oracle prior to version 7 where you manually start and end a performance evaluation periodbStat is short for begin snapshot and is run prior to evaluating some SQL for performance; eStat is short for end snapshot and is run at the end of the performance evaluation period. Together these tools provide performance metrics for the manual snapshot period.
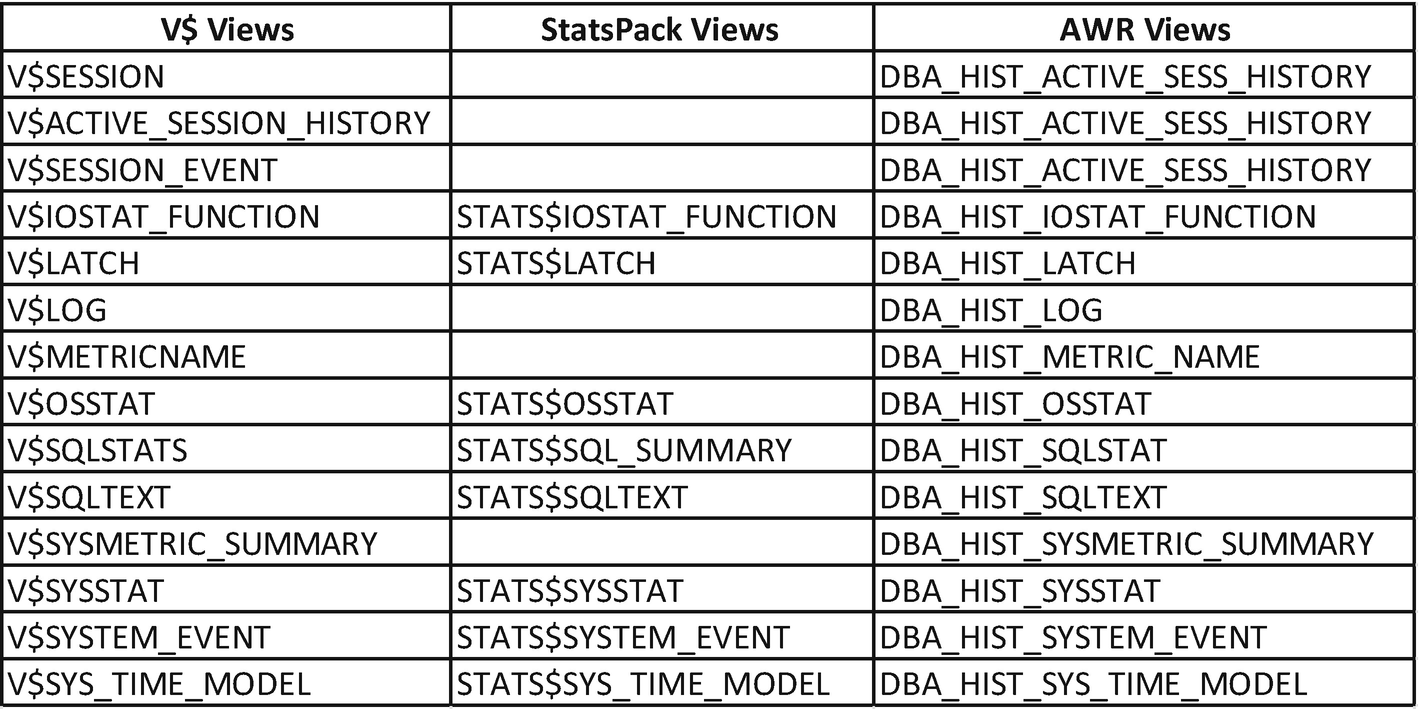
About eight years ago, I became aware of the plethora of metrics persisted in Oracles Automatic Workload Repository. AWR metrics are an even more potent problem-solving tool. Some people refer to AWR as StatsPack on steroids primarily because of the additional metrics provided by ASH (active session history), which give a very detailed picture of what is going on with active sessions, and these metrics are persisted over a very granular time period. AWR also includes some other metrics such as dba_hist_sysmetric_summary, which help to paint a more detailed picture of what is going on in the database. During this metamorphosis of performance metrics, Oracle maintained continuity by providing the same information, but giving it a similar name in the new version of data presentation. Figure gives an example of some performance metric sources represented in the v$ views, StatsPack views, and AWR views.

Figure 1
This table provides an excerpt comparison of some useful v$, StatsPack, and AWR views


