1. Real-Time Network Statistics with Iftop
Monitoring network connections certainly can be frustrating, mainly because they can be established and then disappear within a matter of seconds. In this chapter, I show you how to achieve a Zen-like approach to monitoring network connections on your servers using a command linebased tool called iftop . I then finish by walking through the creation of a configuration file that you can use again on different servers once you have your monitoring set up as you prefer.
Monitoring Network Connections with netstat
The netstat command-line tool has been a staple among system admins. Although rich in features, including an auto-refresh parameter (continuous mode), netstat is certainly not designed to do much more than output raw numbers and names (from hosts and ports). To run netstat in continuous mode, for example, you can use:
# netstat -c
I usually end up running it alongside watch to give me the kind of clean screen refreshes I need for different scenarios; for example:
# watch -n2 "netstat -tu"
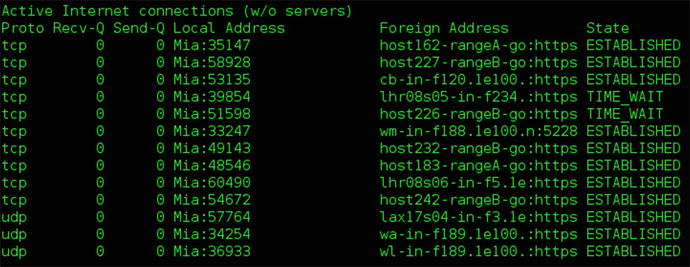
In this example, watch lets me configure a two-second gap prior to running the command again and updating its output (see Figure ).
Figure 1-1.
The watch command executing netstat -tu every two seconds
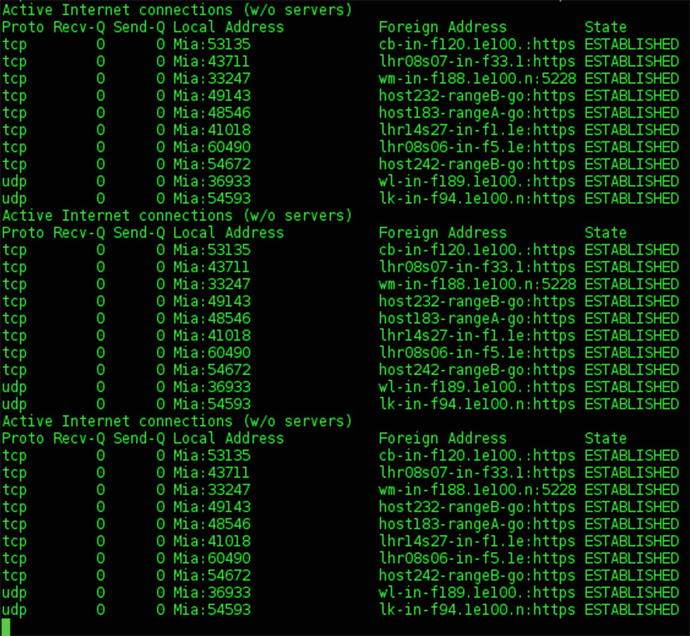
In this scenario, the -tu switch tells netstat to output both TCP and UDP statistics. Using the watch option is far slicker than the continuous -c parameter, because it adds information to the foot of the last output, although the output is still a little messy and difficult to follow. Incidentally, the following netstat command is the one I use the most:
# netstat tulpnc
In Figure , I ask netstat to show all local listening ports and then the processes that they belong to. However, lsof -i , a command concerned with listing open files, is probably more effective.
Figure 1-2.
netstat output displays changing information by repeating the output at the foot of the screen upon refresh
Introducing iftop
Thankfully, theres a utility that takes away painful eyestrain: iftop ( http://www.ex-parrot.com/pdw/iftop/ ). iftop is to networks what top is to CPUs. And, in the same way ifconfig refers to configuring an interface, the friendly iftop stands for interface top.
The main difference between iftop and other command linebased tools is that iftop instantly draws highly useful bar graphs (among other graphical options) and I cant emphasize enough how many times it has saved the day when diagnosing an urgent server or network issue.
The fact that theres no pained preamble with device drivers or libraries iftop just worksmakes all the difference when youre in a hurry. Its small footprint might also be helpful in diagnosing a customer server that doesnt have iftop installed: the tiny package can be easily dropped on a memory stick when the networking is broken on the problematic server.
Installing iftop
On Debian-based systems, you can install iftop with the following command:
# apt-get install iftop
On Red Hat derivatives, you can install the EPEL (Extra Packages for Enterprise Linux) RPM, using for example:
# rpm -ivh http://download.fedoraproject.org/pub/epel/6/i386/epel-release-6-8.noarch.rpm
For older versions of the Red Hat family, you can follow the instructions at http://www.cyberciti.biz/faq/fedora-sl-centos-redhat6-enable-epel-repo/ .
You should then be able to install iftop as usual:
# yum install iftop
If you execute iftop with just an interface to examine, you can spawn it using the following command:
# iftop -i eth0
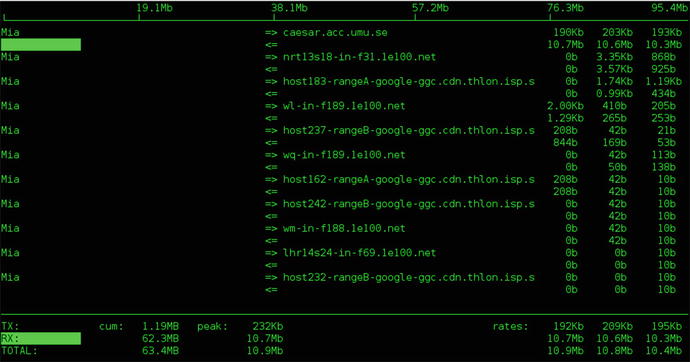
Figure shows a sample output of this command. The output shows a number of remote hosts (including nicknames added to the file /etc/hosts , as well as fully qualified domain names, which are really just normal hostnames that Ive abbreviated) in the middle column and the local machine named Sula in the left column.
Figure 1-3.
The default iftop -i eth0 output listening to an interface enabled
On the right side, you can see three columns. The excellent iftop refers to this as its display order and the columns deal with different time-delay averages. By default, this appears (at least) to be two-second, ten-second, and forty-second averages. These values can be configured separately, so dont let that confuse you too much initially. In addition, its easy to change the overall display using those columns by pressing the 1, 2, or 3 keys to respectively filter by the aforementioned 2s, 10s, or 40s averages.
As an aside, a two-second average is really short; I love it having come from a background filled with what felt like lengthy five-minute SNMP averages. I can see very quickly whats just changed on the network and although two seconds isnt real-time, its very close to it and certainly has its place on todays busy Internet. I find that its just long enough for you to be able to spot something without worrying about freezing the screen in case you missed it.
When youre running the default config without specifying any options, iftop outputs the busiest hosts in the last ten seconds (in other words, by using a ten-second average). It also groups hosts in pairs to choose the busiest pair of combined inbound and outbound traffic.
Finally, at the end of the output, you are presented with a number of totals. These include useful statistics, such as the amount of data transferred in megabytes (MB) as well as forty-second averages of traffic, usually in megabits (Mb), but also sometimes in kb for kilobytes.
Controlling iftop from the Keyboard
In addition to providing a slick graphical display, even through an SSH terminal, iftop lets you modify your configuration at the press of a key. For example, in the course of a sysadmins work day, you could be checking all sorts of bad networking habits: from monitoring the misconfiguration of a network interface to mitigating a hideously hazardous ARP storm. With iftop , you can cycle through a number of options and confidently choose a config parameter to suit your current scenario instantly.
Here are some examples of how iftop can make your sysadmin life easier at the press of key:
To change the source and destination displays, press the s key or the d key while iftop is running. This helps isolate who is sending what, especially if iftop is being run on a Linux router (which Ill touch in Using iftop on Busy Routers later in this chapter) and forwarding traffic.
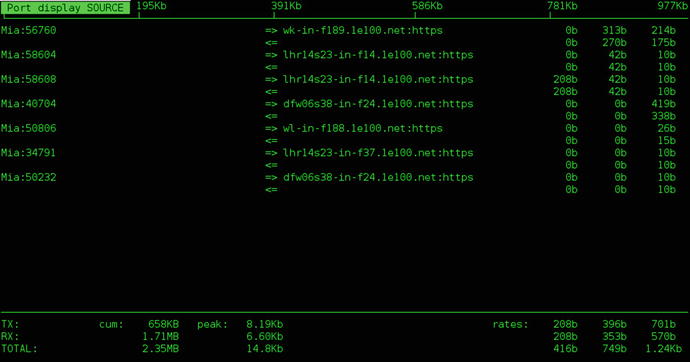
To quickly see which ports are in use, press the p key. You can also use the Shift+S and Shift+D keys to expose source and destination ports, respectively. Figure demonstrates how friendly iftop is with its options and how it dutifully reports, in the top-left of the screen, the result of the keypress that it has just received.


