• Complain

AI Publishing - Data Visualization with Python for Beginners: Step-by-Step Guide with Hands-on Projects and Exercises

Here you can read online AI Publishing - Data Visualization with Python for Beginners: Step-by-Step Guide with Hands-on Projects and Exercises full text of the book (entire story) in english for free. Download pdf and epub, get meaning, cover and reviews about this ebook. year: 2020, publisher: AI Publishing LLC, genre: Computer. Description of the work, (preface) as well as reviews are available. Best literature library LitArk.com created for fans of good reading and offers a wide selection of genres:

Romance novel Science fiction Adventure Detective Science History Home and family Prose Art Politics Computer Non-fiction Religion Business Children Humor

Choose a favorite category and find really read worthwhile books. Enjoy immersion in the world of imagination, feel the emotions of the characters or learn something new for yourself, make an fascinating discovery.

AI Publishing Data Visualization with Python for Beginners: Step-by-Step Guide with Hands-on Projects and Exercises
  • Book:
    Data Visualization with Python for Beginners: Step-by-Step Guide with Hands-on Projects and Exercises
  • Author:
  • Publisher:
    AI Publishing LLC
  • Genre:
  • Year:
    2020
  • Rating:
    5 / 5
  • Favourites:
    Add to favourites
  • Your mark:
    • 100
    • 1
    • 2
    • 3
    • 4
    • 5

Data Visualization with Python for Beginners: Step-by-Step Guide with Hands-on Projects and Exercises: summary, description and annotation

We offer to read an annotation, description, summary or preface (depends on what the author of the book "Data Visualization with Python for Beginners: Step-by-Step Guide with Hands-on Projects and Exercises" wrote himself). If you haven't found the necessary information about the book — write in the comments, we will try to find it.

**GET YOUR COPY NOW, the price will be 12.99$ soon**

Data Visualization using Python for Beginners

Are you looking for a hands-on approach to learn Python for Data Visualization Fast?

Do you need to start learning Python for Data Visualization from Scratch?

This book is for you.
This book works as guide to present fundamental Python Libraries and basis related to Data Visualization using Python.
Data science and data visualization are two different but interrelated concepts. Data science refers to the science of extracting and exploring data in order to find patterns that can be used for decision making at different levels. Data visualization can be considered as a subdomain of data science where you visualize data with the help of graphs and tables in order to find out which data is most significant and can help in the identification of important patterns.
This book is dedicated to data visualization and explains how to perform data visualization on a variety of datasets using various data visualization libraries written in the Python programming language. It is suggested that you use this book for data visualization purposes only and not for decision making. For decision making and pattern identification, read this book in conjunction with a dedicated book on machine learning and data science.
We will start by digging into Python programming as all the projects are developed using it, and it is currently the most used programming language in the world. We will also explore the most-famous libraries for Data Visualization such as Pandas, Numpy, Matplotlib, Seaborn, etc .

What this book offers...

You will learn all about python in three modules, one for Plotting with Matplotlib, one for Plotting with Seaborn, and a final one Pandas for Data Visualization. All three modules will contain hands-on projects using real-world datasets and a lot of exercises.

Clear and Easy to Understand Solutions

All solutions in this book are extensively tested by a group of beta readers. The solutions provided are simplified as much as possible so that they can serve as examples for you to refer to when you are learning a new skill.

What this book aims to do...

This book is written with one goal in mind to help beginners overcome their initial obstacles to learning Data Visualization using Python.
A lot of times, newbies tend to feel intimidated by coding and data.
The goal of this book is to isolate the different concepts so that beginners can gradually gain competency in the fundamentals of Python before working on a project.
Beginners in Python coding and Data Science does not have to be scary or frustrating when you take one step at a time.

Ready to start practicing and visualizing your data using Python? Click the BUY button now to download this book

Topics Covered:

Basic Plotting with Matplotlib
Advanced Plotting with Matplotlib
Introduction to the Python Seaborn Library
Advanced Plotting with Seaborn
Introduction to Pandas Library for Data Analysis
Pandas for Data Visualization
3D Plotting with Matplotlib
Interactive Data Visualization with Bokeh

Interactive Data Visualization with Plotly Hands-on Project Exercises

Click the BUY button and download the book now to start learning and coding Python for Data Visualization.

** MONEY BACK GUARANTEE BY KOBO **

If you arent satisfied, for more information about the Kobo refund service please go to the Kobo help platform or...

AI Publishing: author's other books


Who wrote Data Visualization with Python for Beginners: Step-by-Step Guide with Hands-on Projects and Exercises? Find out the surname, the name of the author of the book and a list of all author's works by series.

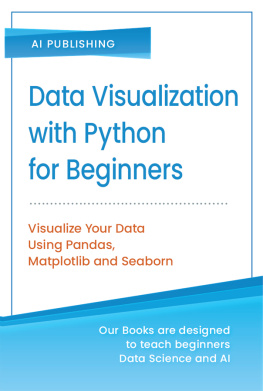
Data Visualization with Python for Beginners: Step-by-Step Guide with Hands-on Projects and Exercises — read online for free the complete book (whole text) full work

Below is the text of the book, divided by pages. System saving the place of the last page read, allows you to conveniently read the book "Data Visualization with Python for Beginners: Step-by-Step Guide with Hands-on Projects and Exercises" online for free, without having to search again every time where you left off. Put a bookmark, and you can go to the page where you finished reading at any time.

Light

Font size:

Reset

Interval:

Bookmark:

Make

DATA VISUALIZATION WITH PYTHON FOR BEGINNERS Visualize Your Data Using Pandas,
Matplotlib and Seaborn
AI PUBLISHING Copyright 2020 by AI Publishing All rights reserved. First Printing, 2020 Edited by AI Publishing Ebook Converted and Cover by Gazler Studio
Published by AI Publishing LLC ISBN-13: 978-1-7330426-8-0 The contents of this book may not be reproduced, duplicated, or transmitted without the direct written permission of the author. Under no circumstances will any legal responsibility or blame be held against the publisher for any reparation, damages, or monetary loss due to the information herein, either directly or indirectly. Legal Notice: You cannot amend, distribute, sell, use, quote, or paraphrase any part of the content within this book without the consent of the author. Disclaimer Notice: Please note the information contained within this document is for educational and entertainment purposes only. No warranties of any kind are expressed or implied.

Readers acknowledge that the author is not engaging in the rendering of legal, financial, medical, or professional advice. Please consult a licensed professional before attempting any techniques outlined in this book. By reading this document, the reader agrees that under no circumstances is the author responsible for any losses, direct or indirect, which are incurred as a result of the use of the information contained within this document, including, but not limited to, errors, omissions, or inaccuracies. How to contact us If you have any feedback, please let us know by sending an email to . This feedback is highly valued, and we look forward to hearing from you. To get the Python codes and materials used in this book, please click the link below: https://www.aispublishing.net/book-data-visualization About the Publisher At AI Publishing Company, we have established an international learning platform specifically for young students, beginners, small enterprises, startups, and managers who are new to data sciences and artificial intelligence. To get the Python codes and materials used in this book, please click the link below: https://www.aispublishing.net/book-data-visualization About the Publisher At AI Publishing Company, we have established an international learning platform specifically for young students, beginners, small enterprises, startups, and managers who are new to data sciences and artificial intelligence.

Through our interactive, coherent, and practical books and courses, we help beginners learn skills that are crucial to developing AI and data science projects. Our courses and books range from basic intro courses to language programming and data sciences to advanced courses for machine learning, deep learning, computer vision, big data, and much more, using programming languages like Python, R, and some data science and AI software. AI Publishings core focus is to enable our learners to create and try proactive solutions for digital problems by leveraging the power of AI and data sciences to the maximum extent. Moreover, we offer specialized assistance in the form of our free online content and ebooks, providing up-to-date and useful insight into AI practices and data-science subjects, along with eliminating the doubts and misconceptions about AI and programming. Our experts have cautiously developed our online courses and kept them concise, short, and comprehensive so that you can understand everything clearly and effectively and start practicing the applications right away. We also offer consultancy and corporate training in AI and data sciences for enterprises so that their staff can navigate through the workflow efficiently.

With AI Publishing, you can always stay closer to the innovative world of AI and data sciences. If you are also eager to learn the A to Z of AI and data sciences but have no clue where to start, AI Publishing is the finest place to go. Please contact us by email at: . AI Publishing is Searching for Authors Like You If youre interested in becoming an author for AI Publishing, please contact us at . We are working with developers and AI tech professionals, just like you, to help them share their insight with the global AI and Data Science lovers. Table of ContentsPreface

Book Approach
The book follows a very simple approach. Table of ContentsPreface
Book Approach
The book follows a very simple approach.

It is divided into 10 chapters. Chapter 1 contains an introduction while the 2nd and 3rd chapters cover the Matplotlib library. Pythons Seaborn library is covered in 4th and 5th chapters while the 6th and 7th chapters explore the Pandas library. The 8th chapter covers 3-D plotting, while the 9th chapter explains how to draw maps via the Basemap library. Finally, the 10th chapter covers interactive data visualization via the Plotly library. In each chapter, different types of plots have been explained theoretically, followed by practical examples.

Each chapter also contains an exercise that students can use to evaluate their understanding of the concepts explained in the chapter. The Python notebook for each chapter is provided in the resources. It is advised that instead of copying the code, you write the code yourself, and in case of error, you match your code with the corresponding Python notebook, find, and then correct the error.

Data Science and Data Visualization
Data science and data visualization are two different but interrelated concepts. Data science refers to the science of extracting and exploring data in order to find patterns that can be used for decision making at different levels. Data visualization can be considered as a subdomain of data science where you visualize data with the help of graphs and tables in order to find out which data is most significant and can help in the identification of important patterns.

Data visualization can also be considered as a standalone discipline where you just want to visually analyze data and base your decision on the visual representation of data. This book is dedicated to data visualization and explains how to perform data visualization on a variety of datasets using various data visualization libraries written in the Python programming language. It is suggested that you use this book for data visualization purposes only and not for decision making. For decision making and pattern identification, read this book in conjunction with a dedicated book on machine learning and data science.

Who Is This Book For?
This book explains the process of data visualization using various libraries from scratch. Hence, the book is aimed ideally at absolute beginners to data visualization.

Though a background in the Python programming language and data visualization can help speed up learning, the book contains a crash course on Python programming language in the first chapter. Therefore, the only prerequisite to efficiently using this book is access to a computer with the internet. All the codes and datasets have been provided. However, to download data visualization libraries, you will need the internet. In addition to beginners in data visualization, this book can also be used as a reference manual by intermediate and experienced programmers as it contains data visualization code samples using multiple data visualization libraries.

How to Use this Book?
As I said earlier, the data visualization libraries taught in this book have been divided into multiple chapters.

To get the best out of this book, I would suggest that you first get your feet wet with the Python programming language, especially the object-oriented programming concepts. To do so, you can take a crash course on Python in chapter 1 of this book. Also, try to read the other chapters of this book in order since concepts taught in the subsequent chapters are based on previous chapters. In each chapter, try to first understand the theoretical concepts behind different types of plots and then try to execute the example code. I would again stress that rather than copy and pasting code, try to write the code yourself, and in case of any error, you can match your code with the source code provided in the book as well as in the Python notebooks in the resources. Finally, try to answer the questions asked in the exercises at the end of each chapter.

Next page
Light

Font size:

Reset

Interval:

Bookmark:

Make

Similar books «Data Visualization with Python for Beginners: Step-by-Step Guide with Hands-on Projects and Exercises»

Look at similar books to Data Visualization with Python for Beginners: Step-by-Step Guide with Hands-on Projects and Exercises. We have selected literature similar in name and meaning in the hope of providing readers with more options to find new, interesting, not yet read works.


Reviews about «Data Visualization with Python for Beginners: Step-by-Step Guide with Hands-on Projects and Exercises»

Discussion, reviews of the book Data Visualization with Python for Beginners: Step-by-Step Guide with Hands-on Projects and Exercises and just readers' own opinions. Leave your comments, write what you think about the work, its meaning or the main characters. Specify what exactly you liked and what you didn't like, and why you think so.