Charles Murray - Human Accomplishment: The Pursuit of Excellence in the Arts and Sciences, 800 B.C. to 1950
Here you can read online Charles Murray - Human Accomplishment: The Pursuit of Excellence in the Arts and Sciences, 800 B.C. to 1950 full text of the book (entire story) in english for free. Download pdf and epub, get meaning, cover and reviews about this ebook. year: 0, genre: History. Description of the work, (preface) as well as reviews are available. Best literature library LitArk.com created for fans of good reading and offers a wide selection of genres:
Romance novel
Science fiction
Adventure
Detective
Science
History
Home and family
Prose
Art
Politics
Computer
Non-fiction
Religion
Business
Children
Humor
Choose a favorite category and find really read worthwhile books. Enjoy immersion in the world of imagination, feel the emotions of the characters or learn something new for yourself, make an fascinating discovery.
- Book:Human Accomplishment: The Pursuit of Excellence in the Arts and Sciences, 800 B.C. to 1950
- Author:
- Genre:
- Year:0
- Rating:4 / 5
- Favourites:Add to favourites
- Your mark:
Human Accomplishment: The Pursuit of Excellence in the Arts and Sciences, 800 B.C. to 1950: summary, description and annotation
We offer to read an annotation, description, summary or preface (depends on what the author of the book "Human Accomplishment: The Pursuit of Excellence in the Arts and Sciences, 800 B.C. to 1950" wrote himself). If you haven't found the necessary information about the book — write in the comments, we will try to find it.
Charles Murray: author's other books
Who wrote Human Accomplishment: The Pursuit of Excellence in the Arts and Sciences, 800 B.C. to 1950? Find out the surname, the name of the author of the book and a list of all author's works by series.


Human Accomplishment: The Pursuit of Excellence in the Arts and Sciences, 800 B.C. to 1950 — read online for free the complete book (whole text) full work
Below is the text of the book, divided by pages. System saving the place of the last page read, allows you to conveniently read the book "Human Accomplishment: The Pursuit of Excellence in the Arts and Sciences, 800 B.C. to 1950" online for free, without having to search again every time where you left off. Put a bookmark, and you can go to the page where you finished reading at any time.
Font size:
Interval:
Bookmark:
C HARLES M URRAY is the W. H. Brady Scholar in Culture and Freedom at the American Enterprise Institute for Public Policy Research in Washington, D.C. He is the author of seven other books, including Losing Ground and The Bell Curve , with Richard J. Herrnstein.
Visit www.AuthorTracker.com for exclusive information on your favorite HarperCollins author.
Australia
HarperCollins Publishers (Australia) Pty. Ltd.
25 Ryde Road (PO Box 321)
Pymble, NSW 2073, Australia
http://www.harpercollinsebooks.com.au
Canada
HarperCollins Publishers Ltd.
55 Avenue Road, Suite 2900
Toronto, ON, M5R, 3L2, Canada
http://www.harpercollinsebooks.ca
New Zealand
HarperCollinsPublishers (New Zealand) Limited
P.O. Box 1
Auckland, New Zealand
http://www.harpercollinsebooks.co.nz
United Kingdom
HarperCollins Publishers Ltd.
77-85 Fulham Palace Road
London, W6 8JB, UK
http://www.harpercollinsebooks.co.uk
United States
HarperCollins Publishers Inc.
10 East 53rd Street
New York, NY 10022
http://www.harpercollinsebooks.com
Losing Ground: American Social Policy 19501980
In Pursuit: Of Happiness and Good Government
The Bell Curve: Intelligence and Class Structure in American Life
(co-author, with Richard J. Herrnstein)
What It Means to Be a Libertarian: A Personal Interpretation
T he following is aimed at the liberal arts graduate who has not taken a math course since high school and knows nothing whatsoever about statistics but wants to understand the statistical terms in the text.
DISTRIBUTIONS AND STANDARD DEVIATIONS
Why Do We Need Standard Deviation?
Every day, formally or informally, people make comparisonsamong people, among apples and oranges, among dairy cows or egg-laying hens, among the screws being coughed out by a screw machine. The standard deviation is a measure of how spread out the things being compared are. This egg is a lot bigger than average, a chicken farmer might say. The standard deviation gives him a way of saying precisely what he means by a lot.
What Is a Frequency Distribution?
To get a clear idea of what a frequency distribution is, imagine yourself back in your high school gym, with all the boys in the senior class assembled before you (including both sexes would complicate matters, and the main point of this discussion is to keep things simple). Line up these boys from left to right in order of height.
Now you have a long line going from shortest to tallest. As you look along the line you will see that only a few boys are conspicuously short and tall. Most are in the middle, and a lot of them seem identical in height. Is there any way to get a better idea of how this pattern looks?
Tape a series of cards to the floor in a straight line from left to right, with 60 inches and shorter written on the one at the far left, 80 inches and taller on the card at the far right, and cards in one-inch increments in between. Tell everyone to stand behind the card that corresponds to his height.
Someone loops a rope over the rafters and pulls you up in the air so you can look straight down on the tops of the heads of your classmates standing in their single files behind the height labels. The figure below shows what you see: a frequency distribution.
The raw material of a frequency distribution
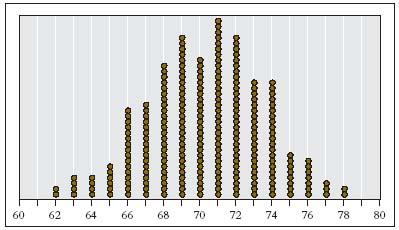
This a frequency distribution. What good is it? Looking at your high school classmates standing around in a mob, you can tell very little about their height. Looking at those same classmates arranged into a frequency distribution, you can tell a lot, quickly and memorably.
How Is the Distribution Related to the Standard Deviation?
We still lack a convenient way of expressing where people are in that distribution. What does it mean to say that two different students are, say, 6 inches different in height? How big is a 6-inch difference? That brings us back to the standard deviation.
When it comes to high school students, you have a good idea of how big a 6-inch difference is. But what does a 6-inch difference mean if you are talking about the height of elephants? About the height of cats? It depends. And the things it depends on are the average height and how much height varies among the things you are measuring. A standard deviation gives you a way of taking both the average and that variability into account, so that 6 inches can be expressed in a way that means the same thing for high school students relative to other high school students, elephants relative to other elephants, and cats relative to other cats.
How Do You Compute a Standard Deviation?
Suppose that your high school class consisted of just two people who were 66 inches and 70 inches. Obviously, the average is 68 inches. Just as obviously, one person is 2 inches shorter than average, one person is 2 inches taller than average. The standard deviation is a kind of average of the differences from the mean2 inches, in this example. Suppose you add two more people to the class, one who is 64 inches and the other who is 72 inches. The mean hasnt changed (the two new people balance each other off exactly). But the newcomers are each 4 inches different from the average height of 68 inches. So the standard deviation, which measures the spread, has gotten bigger as well. Now two people are 4 inches different from the average and two people are 2 inches different from the average. That adds up to a total of 12 inches, divided among four persons. The simple average of these differences from the mean is three inches (124), which is almost (but not quite) what the standard deviation is. To be precise, the standard deviation is calculated by squaring the deviations from the mean, then summing them, then finding their average, then taking the square root of the result. In this example, two people are 4 inches from the mean and two are 2 inches from the mean. The sum of the squared deviations is 40 (i.e., 16+16+4+4). Their average is 10 (404). The square root of 10 is 3.16, which is the standard deviation for this example. The technical reasons for using the standard deviation instead of the simple average of the deviations from the mean are not necessary to go into, except that, in normal distributions, the standard deviation has wonderfully convenient properties. If you are looking for a short, easy way to think of a standard deviation, view it as the average difference from the mean.
As an example of how a standard deviation can be used to compare apples and oranges, suppose we are looking at the Olympic womens gymnastics team and mens NBA basketball teams. You notice a woman who is 5 feet 6 inches and a man who is 7 feet. You know from watching gymnastics on television that 5 feet 6 inches is tall for a woman gymnast, and 7 feet is tall even for a basketball player. But you want to do better than a general impression. Just how unusual is the woman, compared to the average gymnast on the U. S. womens team, and how unusual is the man, compared to the average basketball player on the U. S. mens team?
We gather data on height among all the women gymnasts, and determine that the mean is 5 feet 1 inch with a standard deviation (SD) of 2 inches. For the men basketball players, we find that the mean is 6 feet 6 inches and the SD is 4 inches. Thus the woman who is 5 feet 6 inches is 2.5 standard deviations taller than the average; the seven-foot man is only 1.5 standard deviations taller than the average. These numbers2.5 for the woman and 1.5 for the manare called standard scores in statistical jargon. Now we have an explicit numerical way to compare how different the two people are from their respective averages, and we have a basis for concluding that the woman who is 5 feet 6 inches is a lot taller relative to other female Olympic gymnasts than a 7-foot man is relative to other NBA basketball players.
Font size:
Interval:
Bookmark:
Similar books «Human Accomplishment: The Pursuit of Excellence in the Arts and Sciences, 800 B.C. to 1950»
Look at similar books to Human Accomplishment: The Pursuit of Excellence in the Arts and Sciences, 800 B.C. to 1950. We have selected literature similar in name and meaning in the hope of providing readers with more options to find new, interesting, not yet read works.
Discussion, reviews of the book Human Accomplishment: The Pursuit of Excellence in the Arts and Sciences, 800 B.C. to 1950 and just readers' own opinions. Leave your comments, write what you think about the work, its meaning or the main characters. Specify what exactly you liked and what you didn't like, and why you think so.