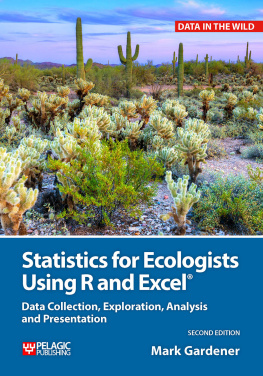
Gardener - Statistics for ecologists using R and Excel : data collection, exploration, analysis and presentation
Here you can read online Gardener - Statistics for ecologists using R and Excel : data collection, exploration, analysis and presentation full text of the book (entire story) in english for free. Download pdf and epub, get meaning, cover and reviews about this ebook. City: Exeter, year: 2012, publisher: Pelagic Pub., genre: Home and family. Description of the work, (preface) as well as reviews are available. Best literature library LitArk.com created for fans of good reading and offers a wide selection of genres:
Romance novel
Science fiction
Adventure
Detective
Science
History
Home and family
Prose
Art
Politics
Computer
Non-fiction
Religion
Business
Children
Humor
Choose a favorite category and find really read worthwhile books. Enjoy immersion in the world of imagination, feel the emotions of the characters or learn something new for yourself, make an fascinating discovery.
- Book:Statistics for ecologists using R and Excel : data collection, exploration, analysis and presentation
- Author:
- Publisher:Pelagic Pub.
- Genre:
- Year:2012
- City:Exeter
- Rating:5 / 5
- Favourites:Add to favourites
- Your mark:
- 100
- 1
- 2
- 3
- 4
- 5
Statistics for ecologists using R and Excel : data collection, exploration, analysis and presentation: summary, description and annotation
We offer to read an annotation, description, summary or preface (depends on what the author of the book "Statistics for ecologists using R and Excel : data collection, exploration, analysis and presentation" wrote himself). If you haven't found the necessary information about the book — write in the comments, we will try to find it.
Gardener: author's other books
Who wrote Statistics for ecologists using R and Excel : data collection, exploration, analysis and presentation? Find out the surname, the name of the author of the book and a list of all author's works by series.
Statistics for ecologists using R and Excel : data collection, exploration, analysis and presentation — read online for free the complete book (whole text) full work
Below is the text of the book, divided by pages. System saving the place of the last page read, allows you to conveniently read the book "Statistics for ecologists using R and Excel : data collection, exploration, analysis and presentation" online for free, without having to search again every time where you left off. Put a bookmark, and you can go to the page where you finished reading at any time.
Font size:
Interval:
Bookmark:
Statistics for Ecologists
Using R and Excel
Data collection, exploration,
analysis and presentation
Mark Gardener
DATA IN THE WILD SERIES
Pelagic Publishing | www.pelagicpublishing.com
Published by Pelagic Publishing
www.pelagicpublishing.com
PO Box 725, Exeter, EX1 9QU
Statistics for Ecologists Using R and Excel
Data collection, exploration, analysis and presentation
ISBN 978-1-907807-12-1 (Pbk)
ISBN 978-1-907807-13-8 (Hbk)
Copyright 2012 Mark Gardener
All rights reserved. No part of this document may be produced, stored in a retrieval system, or transmitted in any form or by any means, electronic, mechanical, photocopying, recording or otherwise without prior permission from the publisher.
While every effort has been made in the preparation of this book to ensure the accuracy of the information presented, the information contained in this book is sold without warranty, either express or implied. Neither the author, nor Pelagic Publishing, its agents and distributors will be held liable for any damage or loss caused or alleged to be caused directly or indirectly by this book.
Windows, Excel and Word and are trademarks of the Microsoft Corporation. For more information visit www.microsoft.com. OpenOffice.org is a trademark of Oracle. For more information visit www.openoffice.org. Apple Macintosh is a trademark of Apple Inc. For more information visit www.apple.com.
British Library Cataloguing in Publication Data
A catalogue record for this book is available from the British Library.
Cover image istockphoto.com/dulezidar
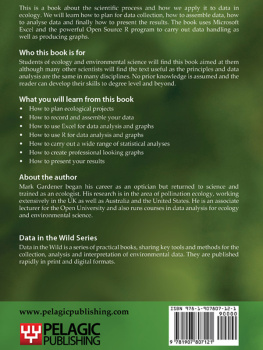
About the author
Mark began his career as an optician but returned to science and trained as an ecologist. His research is in the area of pollination ecology. He has worked extensively in the UK as well as Australia and the United States. Currently he works as an associate lecturer for the Open University and also runs courses in data analysis for ecology and environmental science.
Acknowledgements
I am especially grateful to Nigel Massen at Pelagic Publishing for his help and perseverance throughout the production of this book.
Thanks go to Anne Goodenough for patiently and thoroughly reviewing the manuscript, your comments and views were most helpful.
With a book of this nature data examples are always useful. Some of the data illustrated here were collected by students and I gratefully acknowledge their efforts and send thanks for allowing me to use these data as examples.
Finally my heartfelt thanks go to Christine, for putting up with me throughout the entire process.
Software used
Various versions of Microsofts Excel spreadsheet were used in the preparation of this manuscript. Most of the examples presented show version 2007 for Microsoft Windows although other versions may also be illustrated (including Excel X for Apple Macintosh).
Several versions of the R program were used and illustrated including 2.8.1. for Windows and 2.11.1 for Macintosh: R Foundation for Statistical Computing, Vienna, Austria. ISBN 3-900051-07-0, URL http://www.R-project.org/.
Downloading free code examples
Free code examples and further information from the author on using R and Excel for statistics can be found at:
http://www.pelagicpublishing.com/statistics-for-ecologists-resources.html
Reader feedback
We welcome feedback from readers please email us at info@pelagicpublishing.com and tell us what you thought about this book. Please include the book title in the subject line of your email.
Publish with Pelagic Publishing
We publish scientific books to the highest editorial standards in all life science disciplines, with a particular focus on ecology, conservation and environment. Pelagic Publishing produces books that set new benchmarks, share advances in research methods and encourage and inform wildlife investigation for all.
If you are interested in publishing with Pelagic please contact editor@pelagicpublishing.com with a synopsis of your book, a brief history of your previous written work and a statement describing the impact you would like your book to have on readers.
Contents
This is not just a statistics textbook! Although there are plenty of statistical analyses here, this book is about the processes involved in looking at data. These processes involve planning what you want to do, writing down what you found and writing up what your analyses showed. The statistics part is also in there of course but this is not a course in sta tistics. By the end I hope that you will have learnt some statistics but in a practical way, i.e. what statistics can do for you . In order to learn about the methods of analysis, well use two main tools: a Microsoft Excel spreadsheet (although Open Office will work just as well) and a computer program called R. The spreadsheet will allow you to collect your data in a sensible layout and also do some basic analyses (as well as a few less basic ones). The R program will do much of the detailed statistical work (although we will also use Excel quite a bit). Both programs will be used to produce graphs. This book is not a course in computer programming; well learn just enough about the programs to get the job done .
It is important to recognise that there is a process involved. This is the scientific process and may be summarised by four main headings:
- Planning
- Data recording
- Data exploration
- Reporting results
The book is arranged into these four broad categories. The sections are rather uneven in size and tend to focus on the analysis. The section on reporting also covers presentation of analyses (e.g. graphs).
Although the emphasis is on ecological work and many of the data examples are of that sort, I hope that other scientists and students of other disciplines will see relevance to what they do.
Mark Gardener 2011
Science is a way of looking at the natural world. In short, the process goes along the following lines:
- You have an idea about something.
- You come up with a hypothesis.
- You work out a way of testing this hypothesis/idea.
- You collect appropriate data in order to apply a test.
- You test the hypothesis and decide if the original idea is supported or rejected.
- If the hypothesis is rejected, then the original idea is modified to take the new findings into account.
- The process then repeats.
In this way, ideas are continually refined and our knowledge of the natural world is expanded. We can split the scientific process into four parts (more or less): planning, recording, analysing and reporting.
Table 1. Stages in the scientific method
| Planning | Recording | Analysing | Reporting |
| This is the stage where you work out what you are going to do. Formulate your idea(s), undertake background research, decide what your hypothesis will be and determine a method of collecting the appropriate data and a means by which the hypothesis may be tested. | The means of data collection is determined at the planning stage although you may undertake a small pilot study to see if it works out. After the pilot stage you may return to the planning stage and refine the methodology. Data is finally collected and arranged in a manner that allows you to begin the analysis. | The method of analysis should have been determined at the planning stage. Analytical methods (often involving statistics) are used to test the null hypothesis. If the null hypothesis is rejected then this supports the original idea/hypothesis. | Disseminating your work is vitally important. Your results need to be delivered in an appropriate manner so they can be understood by your peers (and often by the public). Part of the reporting process is to determine what the future direction needs to be. |
Font size:
Interval:
Bookmark:
Similar books «Statistics for ecologists using R and Excel : data collection, exploration, analysis and presentation»
Look at similar books to Statistics for ecologists using R and Excel : data collection, exploration, analysis and presentation. We have selected literature similar in name and meaning in the hope of providing readers with more options to find new, interesting, not yet read works.
Discussion, reviews of the book Statistics for ecologists using R and Excel : data collection, exploration, analysis and presentation and just readers' own opinions. Leave your comments, write what you think about the work, its meaning or the main characters. Specify what exactly you liked and what you didn't like, and why you think so.

