Excel Pivot Tables
Basic Beginners Guide to Learn Excel Pivot Tables for Data Analysis and Modeling
MG Martin
Copyright 2019 - _____MG Martin____ All rights reserved.
The contents of this book may not be reproduced, duplicated or transmitted without direct written permission from the author.
Under no circumstances will any legal responsibility or blame be held against the publisher for any reparation, damages, or monetary loss due to the information herein, either directly or indirectly.
Legal Notice:
This book is copyright protected. This is only for personal use. You cannot amend, distribute, sell, use, quote or paraphrase any part or the content within this book without the consent of the author.
Disclaimer Notice:
Please note the information contained within this document is for educational and entertainment purposes only. Every attempt has been made to provide accurate, up to date and reliable complete information. No warranties of any kind are expressed or implied. Readers acknowledge that the author is not engaging in the rendering of legal, financial, medical or professional advice. The content of this book has been derived from various sources. Please consult a licensed professional before attempting any techniques outlined in this book.
By reading this document, the reader agrees that under no circumstances is the author responsible for any losses, direct or indirect, which are incurred as a result of the use of information contained within this document, including, but not limited to, errors, omissions, or inaccuracies.
Table of Contents
Introduction
Chapter One: An Introduction to Pivot Tables
Insert A Pivot Table
Drag Fields In A Pivot
Sort Data In A Pivot
Filter The Pivot
Change Summary Calculation
Two-Dimensional Pivot Table
Chapter Two: Advantages and Disadvantages of Pivot Tables
Advantages of Pivot Tables
Disadvantages of Pivot Tables
Chapter Three: What Can You Do With Pivot Tables?
Working With Tables
Focus On Auditing The Data
Refreshing The Pivot
Subtotals
Report Layouts
Change the Value Field Setting
Number Formatting
Format Error Values
Format Empty Cells
Keep Column Widths Constant
Showing The Report Filters On Multiple Sheets
Average
Calculates A Unique Count
Percent Of grand Total
Percentage of Column Total
Percentage of Row Total
Variance Calculations
Running Total In
Group By Date
Group By years and quarters
Sorting By Largest Or Smallest
Sort Using custom Lists
Filter By Dates
Filtering by values
Inserting Slicers
Slicer Styles
Slicer Connections Between Multiple Pivots
Filtering A Slicer
Creating Calculated Fields
Creating Calculated Items In A Pivot
Insert A Pivot Chart
Pivot Chart And Slicers
Highlight Cells Based on Their Values
Chapter Four: Manipulating Data For A Pivot Table
Accessing The Data
Source Data Fields
Shared Pivot Tables
Preparing The Source Data
Conclusion
Reference:
Introduction
I want to thank you for choosing this book, Excel Pivot Tables - Basic Beginners Guide to Learn Excel Pivot Tables for Data Analysis and Modeling.
Most organizations and businesses use Excel to perform data analysis. These organizations also use it for modeling. There are numerous features and add-ins that Excel offers which make it easier to perform data analysis and modeling. A pivot table is one such feature provided by Excel.
You can analyze a million rows of data within a few clicks, show the required results, create a pivot chart or report, drag the necessary fields around and highlight the necessary information. It is imperative that people who use excel are well versed with using pivots. If you are looking to learn more about what a pivot table is and how you can use it for data analysis, you have come to the right place.
Over the course of the book, you will learn more about what a pivot table is, how you can create a pivot table, the different ways you can use a pivot table and much more. The information in the book is easy to understand and will guide you on how you can use a pivot table to analyze data.
Thank you for purchasing the book. I hope you gather the information you are looking for.
Chapter One: An Introduction to Pivot Tables
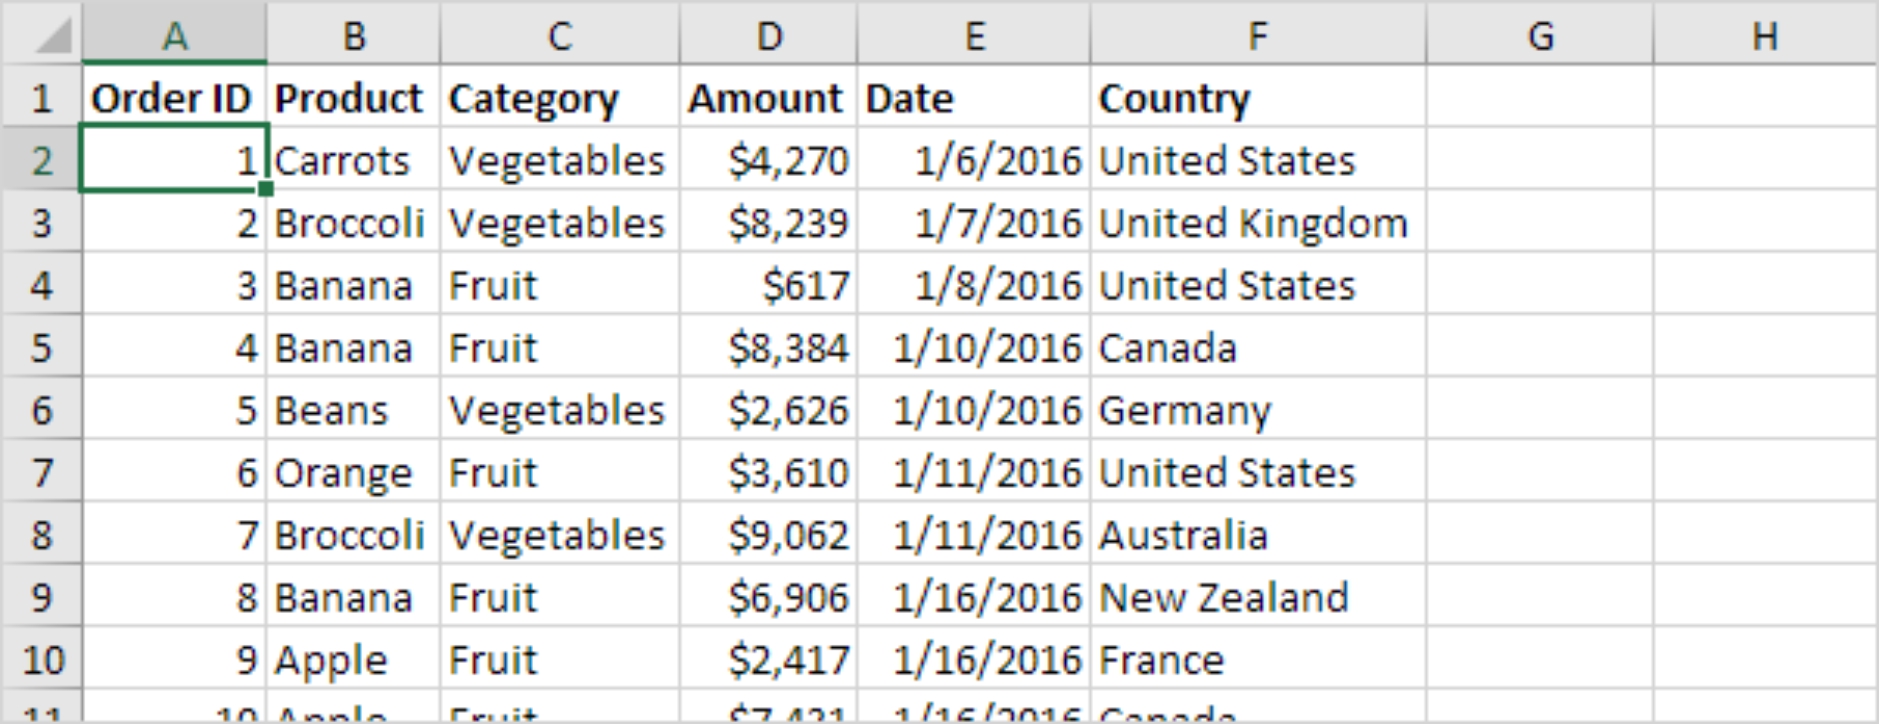
A pivot table is one of the most powerful tools or features that Excel offers. You can extract a significant amount of information from a large data set using a pivot table. For the purpose of this chapter, we will be using a data set that contains 213 rows and 6 headers or fields namely, Order ID, Product, Category, Amount, Date and Country.
Let us now look at how we can insert a pivot table to organize the data set.
Insert a Pivot Table
You should follow the steps mentioned below if you want to insert a pivot table in Excel.
Select any cell that is within the data set.
Go to the tab Insert and check the Tables group. Click the Pivot Table option.
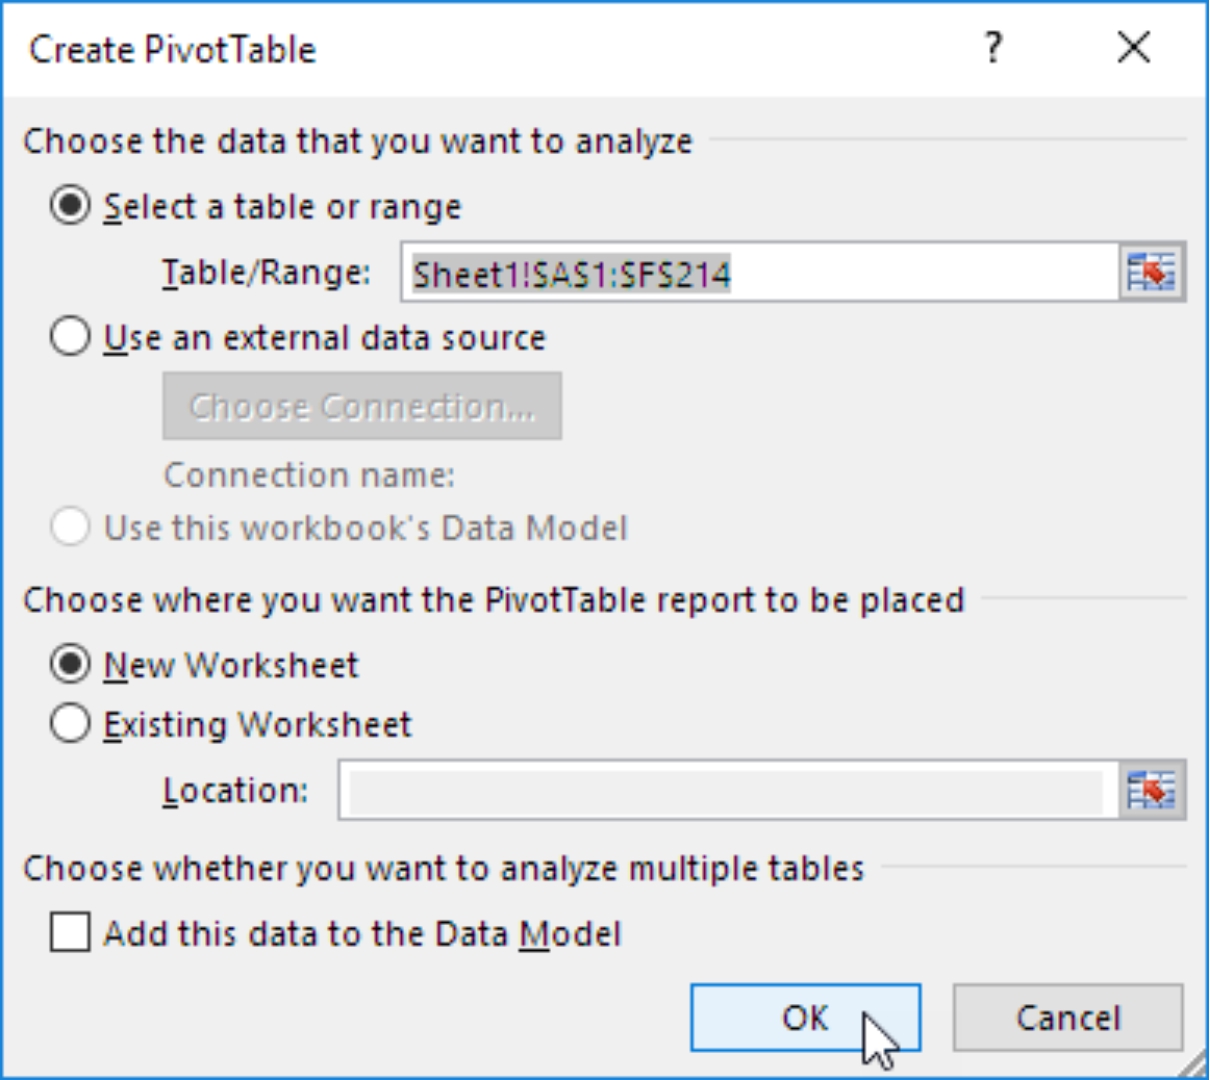
You will see the dialog box below on your screen. If you look clearly at the image below, you will notice that Excel has automatically selected the data for you. Excel always chooses the default location for a pivot as a New Worksheet.
c

Click OK.
You will see that a New Worksheet has opened with a pivot table that is linked to your data set. Alternatively, you can instruct Excel to create the pivot table in the same worksheet if needed.
Drag Fields in a Pivot
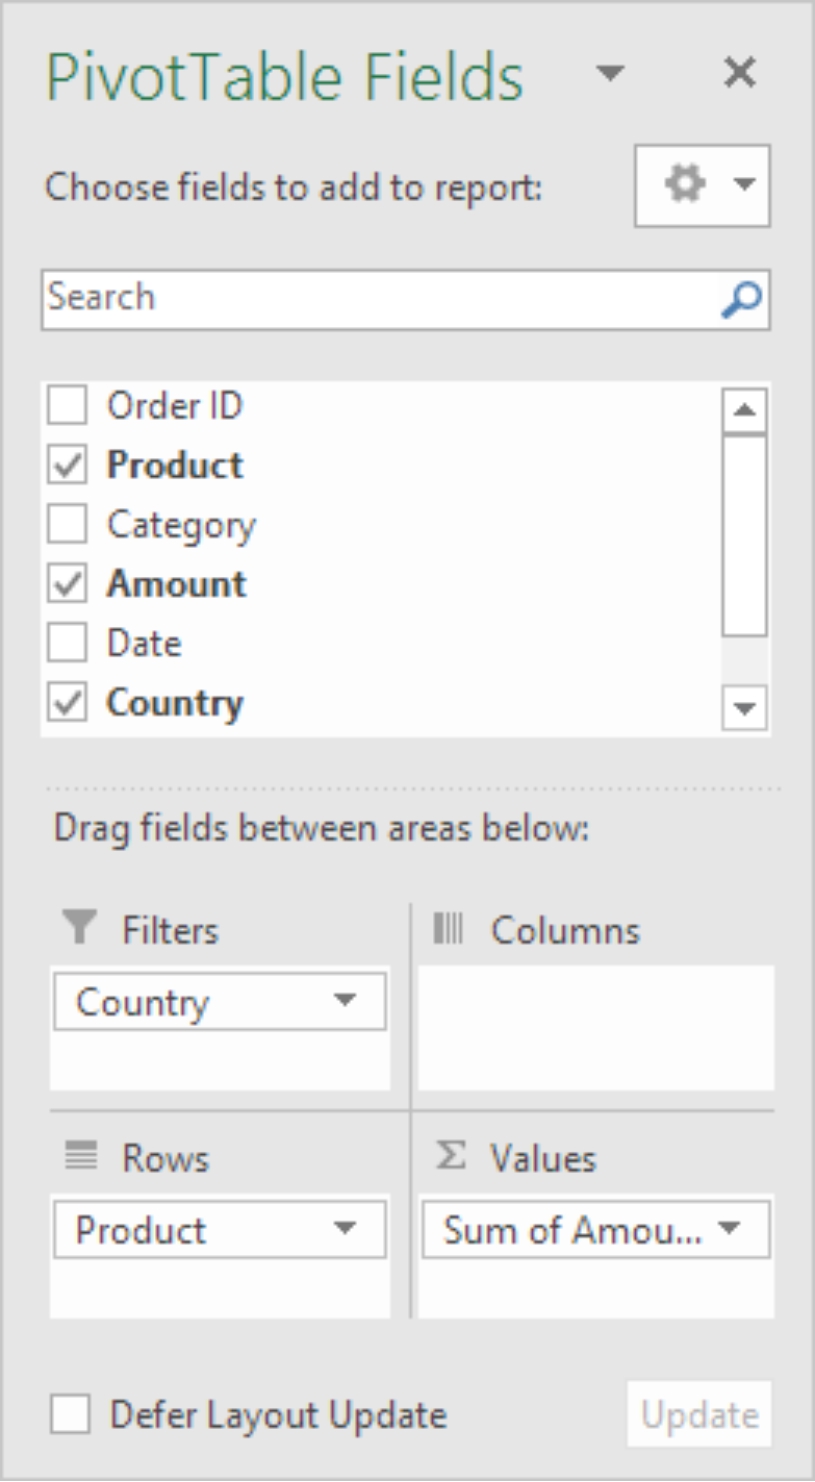
Once you create the pivot table, you will see the Pivot Table pane appear on the right side of your screen. For the purpose of this example, we want to calculate the total amount that was exported for each product. To do this, you will need to drag the following fields into the different areas at the bottom of the Pivot Table pane.
Amount field in Values Area.
Product field in Rows Area.
Country field in the Filters Area.
Your Pivot Table panel will now look like the image below:
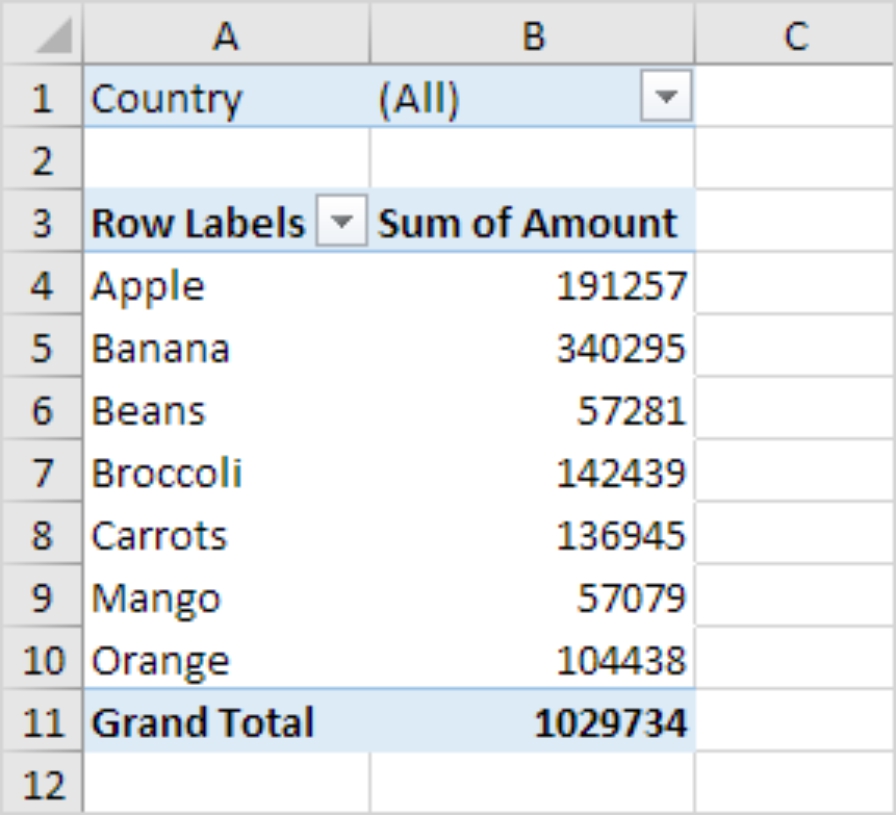
You will see that the pivot table has been created in the Excel sheet. This is how easy it is to create and use a pivot table. From the pivot table that was created, you will notice that the main export is Bananas.
Sort Data in a Pivot


